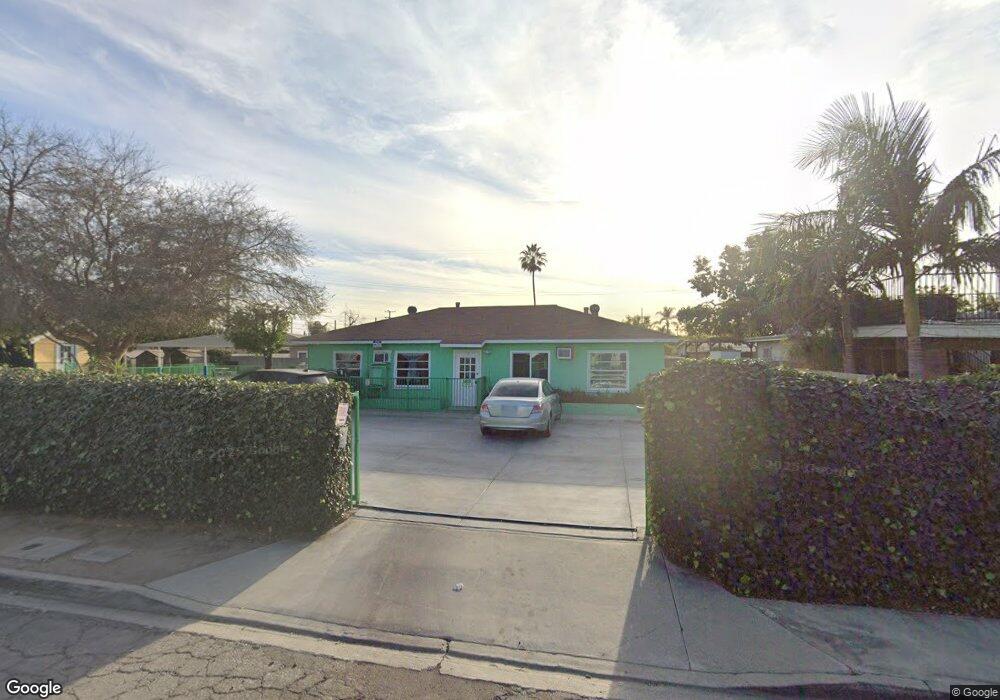
14032 Dillerdale St La Puente, CA 91746
West Puente Valley NeighborhoodEstimated Value: $1,526,462
--
Bed
--
Bath
1,832
Sq Ft
$833/Sq Ft
Est. Value
About This Home
This home is located at 14032 Dillerdale St, La Puente, CA 91746 and is currently estimated at $1,526,462, approximately $833 per square foot. 14032 Dillerdale St is a home located in Los Angeles County with nearby schools including J.E. Van Wig Elementary School, Torch Middle School, and Bassett Senior High School.
Ownership History
Date
Name
Owned For
Owner Type
Purchase Details
Closed on
May 1, 2017
Sold by
Lacson Educational Services Inc
Bought by
Nguyen Kevin and Nguyen Kimberly
Current Estimated Value
Home Financials for this Owner
Home Financials are based on the most recent Mortgage that was taken out on this home.
Original Mortgage
$238,888
Outstanding Balance
$198,882
Interest Rate
4.14%
Estimated Equity
$1,327,580
Purchase Details
Closed on
Aug 31, 2010
Sold by
Atienza Oscar S and Atienza Loida
Bought by
Lacson Educational Services Inc
Purchase Details
Closed on
Mar 20, 1996
Sold by
Baca Daniel R and Baca Annabella S
Bought by
Atienza Oscar and Atienza Loida
Home Financials for this Owner
Home Financials are based on the most recent Mortgage that was taken out on this home.
Original Mortgage
$360,000
Interest Rate
6.98%
Mortgage Type
Commercial
Create a Home Valuation Report for This Property
The Home Valuation Report is an in-depth analysis detailing your home's value as well as a comparison with similar homes in the area
Home Values in the Area
Average Home Value in this Area
Purchase History
| Date | Buyer | Sale Price | Title Company |
|---|---|---|---|
| Nguyen Kevin | $889,000 | Wfg Title Company | |
| Lacson Educational Services Inc | -- | Accommodation | |
| Atienza Oscar | $400,000 | Old Republic Title Company |
Source: Public Records
Mortgage History
| Date | Status | Borrower | Loan Amount |
|---|---|---|---|
| Open | Nguyen Kevin | $238,888 | |
| Previous Owner | Atienza Oscar | $360,000 |
Source: Public Records
Tax History Compared to Growth
Tax History
| Year | Tax Paid | Tax Assessment Tax Assessment Total Assessment is a certain percentage of the fair market value that is determined by local assessors to be the total taxable value of land and additions on the property. | Land | Improvement |
|---|---|---|---|---|
| 2025 | $8,544 | $613,944 | $468,873 | $145,071 |
| 2024 | $8,544 | $601,907 | $459,680 | $142,227 |
| 2023 | $8,299 | $590,106 | $450,667 | $139,439 |
| 2022 | $7,957 | $578,536 | $441,831 | $136,705 |
| 2021 | $7,822 | $567,193 | $433,168 | $134,025 |
| 2019 | $7,637 | $550,371 | $420,321 | $130,050 |
| 2018 | $7,316 | $539,580 | $412,080 | $127,500 |
| 2016 | $4,532 | $308,441 | $189,394 | $119,047 |
| 2015 | $4,431 | $303,809 | $186,550 | $117,259 |
| 2014 | $4,243 | $297,859 | $182,896 | $114,963 |
Source: Public Records
Map
Nearby Homes
- 14104 Barrydale St
- 1416 Millbury Ave
- 13974 Francisquito Ave Unit 8
- 1525 Bromley Ave
- 1718 Puente Ave Unit 40
- 1735 Puente Ave Unit 30
- 1003 Le Borgne Ave
- 979 Willow Ave Unit 31
- 943 Willow Ave
- 3060 Vineland Ave Unit 7
- 915 Stichman Ave
- 3004 Via Delores
- 720 Le Borgne Ave
- 3314 Baldwin Park Blvd
- 1311 S Leland Ave
- 13522 Francisquito Ave Unit C
- 13438 Francisquito Ave
- 1240 S Bromley Ave
- 1816 W Yarnell St
- 13655 Foster Ave Unit 2
- 14045 Barrydale St
- 14039 Barrydale St
- 14045 Dillerdale St
- 14039 Dillerdale St
- 14026 Dillerdale St
- 14033 Dillerdale St
- 14027 Barrydale St
- 14102 Dillerdale St
- 14103 Barrydale St
- 14020 Dillerdale St
- 14027 Dillerdale St
- 14021 Barrydale St
- 14038 Donaldale St
- 14046 Donaldale St
- 14108 Dillerdale St
- 14023 Dillerdale St
- 14032 Donaldale St
- 14021 Dillerdale St
- 14038 Barrydale St
- 14044 Barrydale St