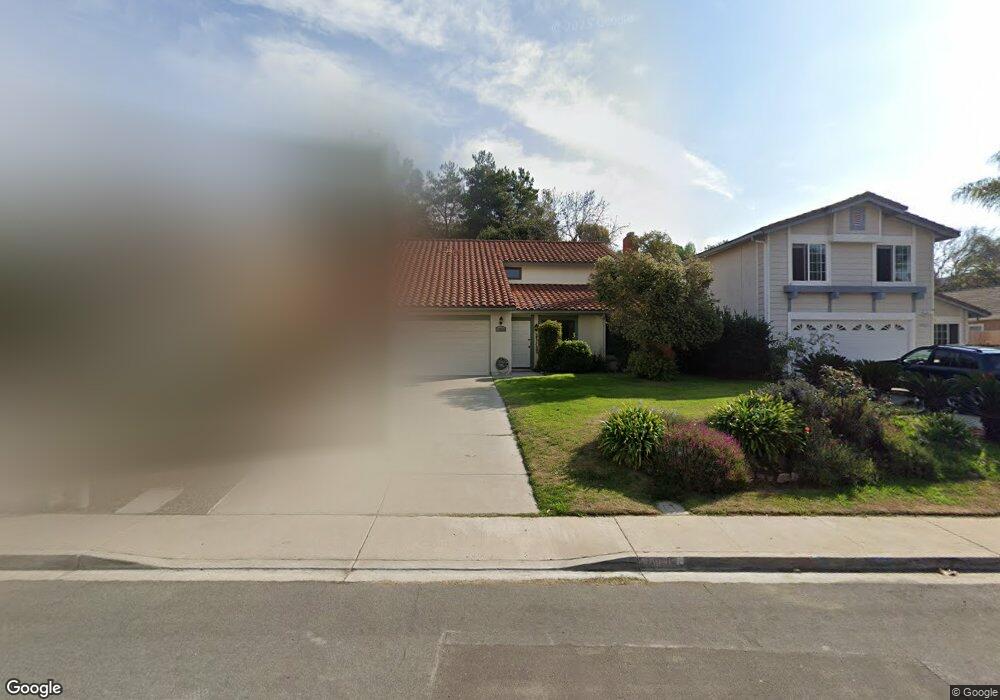
14035 Barrymore St San Diego, CA 92129
Rancho Peñasquitos NeighborhoodEstimated Value: $1,470,000 - $1,517,000
5
Beds
3
Baths
1,962
Sq Ft
$760/Sq Ft
Est. Value
About This Home
This home is located at 14035 Barrymore St, San Diego, CA 92129 and is currently estimated at $1,491,547, approximately $760 per square foot. 14035 Barrymore St is a home located in San Diego County with nearby schools including Adobe Bluffs Elementary School, Black Mountain Middle School, and Mt. Carmel High School.
Ownership History
Date
Name
Owned For
Owner Type
Purchase Details
Closed on
Jun 4, 2002
Sold by
Carleton Joel L and Carleton Kathleen A
Bought by
Carleton Joel Lawrence and Carleton Kathleen Ann
Current Estimated Value
Home Financials for this Owner
Home Financials are based on the most recent Mortgage that was taken out on this home.
Original Mortgage
$240,000
Outstanding Balance
$98,314
Interest Rate
6.37%
Estimated Equity
$1,393,233
Purchase Details
Closed on
Nov 22, 1999
Sold by
Carleton Joel L and Carleton Kathleen A
Bought by
Carleton Joel Lawrence and Carleton Kathleen
Purchase Details
Closed on
Aug 5, 1999
Sold by
Bochy Bruce D and Bochy Kimberly J
Bought by
Carleton Joel L and Carleton Kathleen A
Home Financials for this Owner
Home Financials are based on the most recent Mortgage that was taken out on this home.
Original Mortgage
$240,000
Interest Rate
7.25%
Purchase Details
Closed on
Nov 16, 1984
Create a Home Valuation Report for This Property
The Home Valuation Report is an in-depth analysis detailing your home's value as well as a comparison with similar homes in the area
Home Values in the Area
Average Home Value in this Area
Purchase History
| Date | Buyer | Sale Price | Title Company |
|---|---|---|---|
| Carleton Joel Lawrence | -- | Commonwealth Land Title Co | |
| Carleton Joel L | -- | Commonwealth Land Title Co | |
| Carleton Joel Lawrence | -- | -- | |
| Carleton Joel L | $302,000 | Fidelity National Title | |
| -- | $133,000 | -- |
Source: Public Records
Mortgage History
| Date | Status | Borrower | Loan Amount |
|---|---|---|---|
| Open | Carleton Joel L | $240,000 | |
| Closed | Carleton Joel L | $240,000 |
Source: Public Records
Tax History Compared to Growth
Tax History
| Year | Tax Paid | Tax Assessment Tax Assessment Total Assessment is a certain percentage of the fair market value that is determined by local assessors to be the total taxable value of land and additions on the property. | Land | Improvement |
|---|---|---|---|---|
| 2025 | $5,103 | $464,142 | $84,981 | $379,161 |
| 2024 | $5,103 | $455,042 | $83,315 | $371,727 |
| 2023 | $4,992 | $446,121 | $81,682 | $364,439 |
| 2022 | $4,906 | $437,375 | $80,081 | $357,294 |
| 2021 | $4,840 | $428,800 | $78,511 | $350,289 |
| 2020 | $4,774 | $424,404 | $77,706 | $346,698 |
| 2019 | $4,648 | $416,083 | $76,183 | $339,900 |
| 2018 | $4,516 | $407,926 | $74,690 | $333,236 |
| 2017 | $4,393 | $399,928 | $73,226 | $326,702 |
| 2016 | $4,302 | $392,088 | $71,791 | $320,297 |
| 2015 | $4,237 | $386,199 | $70,713 | $315,486 |
| 2014 | $4,136 | $378,635 | $69,328 | $309,307 |
Source: Public Records
Map
Nearby Homes
- 13907 Bruyere Ct
- 8862 La Cartera St
- 8730 Twin Trails Dr
- 9120 Meadowrun Place
- 14305 El Vestido St
- 9360 Stargaze Ave
- 13559 Chaco Ct
- 14442 Calle Nublado
- 9151 Emden Rd
- 13445 Appalachian Way
- 8183 Doug Hill
- 13146 Thunderhead St
- 13411 Appalachian Way
- 13640 Via Cima Bella
- 9555 Via Pereza
- 7795 Sendero Angelica
- 9302 Twin Trails Dr Unit 204
- 12880 War Horse St
- 13856 Paseo Cardiel
- 9488 Hiker Hill Rd
- 14045 Barrymore St
- 14025 Barrymore St
- 14015 Barrymore St
- 14055 Barrymore St
- 14065 Barrymore St
- 9010 Rotherham Ave
- 9020 Rotherham Ave
- 14040 Barrymore St
- 14034 Barrymore St
- 14075 Barrymore St
- 14050 Barrymore St
- 14024 Barrymore St
- 9030 Rotherham Ave
- 14060 Barrymore St
- 14014 Barrymore St
- 14085 Barrymore St
- 14004 Barrymore St
- 14066 Barrymore St
- 8995 Hampe Ct
- 9040 Rotherham Ave