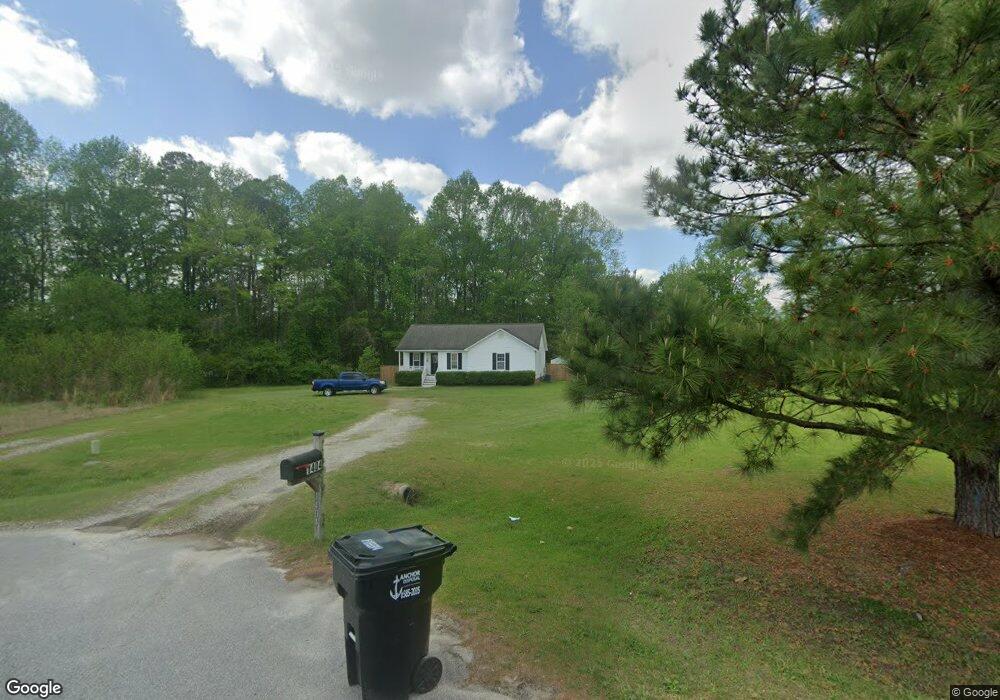
1404 Porchlight Ct Raleigh, NC 27603
Estimated Value: $269,000 - $336,000
3
Beds
2
Baths
1,237
Sq Ft
$244/Sq Ft
Est. Value
About This Home
This home is located at 1404 Porchlight Ct, Raleigh, NC 27603 and is currently estimated at $301,465, approximately $243 per square foot. 1404 Porchlight Ct is a home located in Wake County with nearby schools including Rand Road Elementary, North Garner Middle, and South Garner High.
Ownership History
Date
Name
Owned For
Owner Type
Purchase Details
Closed on
Nov 21, 2003
Sold by
Wm Specialty Mortgage Llc
Bought by
Faircloth William and Faircloth Deborah
Current Estimated Value
Home Financials for this Owner
Home Financials are based on the most recent Mortgage that was taken out on this home.
Original Mortgage
$97,900
Outstanding Balance
$45,513
Interest Rate
6.04%
Mortgage Type
VA
Estimated Equity
$255,952
Purchase Details
Closed on
Sep 5, 2003
Sold by
Williams Arinzo J and Williams Joyce A
Bought by
Wm Specialty Mortgage Llc
Purchase Details
Closed on
Jan 31, 2001
Sold by
Allen Thornton Homes Inc
Bought by
Williams Arinzo J and Williams Joyce A
Home Financials for this Owner
Home Financials are based on the most recent Mortgage that was taken out on this home.
Original Mortgage
$98,910
Interest Rate
12%
Purchase Details
Closed on
Mar 30, 2000
Sold by
Ashley Turner Enterprises Inc
Bought by
Allen Thornton Homes Inc
Create a Home Valuation Report for This Property
The Home Valuation Report is an in-depth analysis detailing your home's value as well as a comparison with similar homes in the area
Home Values in the Area
Average Home Value in this Area
Purchase History
| Date | Buyer | Sale Price | Title Company |
|---|---|---|---|
| Faircloth William | $98,000 | -- | |
| Wm Specialty Mortgage Llc | $94,500 | -- | |
| Williams Arinzo J | $110,000 | -- | |
| Allen Thornton Homes Inc | $152,500 | -- |
Source: Public Records
Mortgage History
| Date | Status | Borrower | Loan Amount |
|---|---|---|---|
| Open | Faircloth William | $97,900 | |
| Previous Owner | Williams Arinzo J | $98,910 | |
| Closed | Williams Arinzo J | $5,495 |
Source: Public Records
Tax History Compared to Growth
Tax History
| Year | Tax Paid | Tax Assessment Tax Assessment Total Assessment is a certain percentage of the fair market value that is determined by local assessors to be the total taxable value of land and additions on the property. | Land | Improvement |
|---|---|---|---|---|
| 2025 | $1,698 | $262,373 | $95,000 | $167,373 |
| 2024 | $1,649 | $262,373 | $95,000 | $167,373 |
| 2023 | $1,249 | $157,569 | $28,000 | $129,569 |
| 2022 | $1,158 | $157,569 | $28,000 | $129,569 |
| 2021 | $1,127 | $157,569 | $28,000 | $129,569 |
| 2020 | $1,109 | $157,569 | $28,000 | $129,569 |
| 2019 | $960 | $115,130 | $26,000 | $89,130 |
| 2018 | $884 | $115,130 | $26,000 | $89,130 |
| 2017 | $839 | $115,130 | $26,000 | $89,130 |
| 2016 | $822 | $115,130 | $26,000 | $89,130 |
| 2015 | $881 | $123,970 | $34,000 | $89,970 |
| 2014 | $836 | $123,970 | $34,000 | $89,970 |
Source: Public Records
Map
Nearby Homes
- 1009 Feldmen Dr
- 1101 Robinfield Dr
- 449 Kings Hollow Dr
- 5013 Contender Dr
- 1005 Turner Meadow Dr
- 10001 Joe Leach Rd
- 1220 Turner Woods Dr
- 6009 Swales Way
- 2704 Stageline Dr
- 2600 Banks Rd Unit Lot 2
- 2600 Banks Rd Unit Lot 1
- 1233 Azalea Garden Cir
- 1021 Wintu Ct
- 1017 Azalea Garden Cir
- 2400 Trueway Ln
- 1025 Azalea Garden Cir
- 1017 Widgeon Way
- 1559 Upchurch Woods Dr
- 1033 Azalea Garden Cir
- 1037 Azalea Garden Cir
- 1409 Porchlight Ct
- 5712 Holland Farms Way
- 5708 Holland Farms Way
- 1405 Porchlight Ct
- 1223 Harvey Johnson Rd
- 1401 Porchlight Ct
- 1411 Paulawood Ln
- 5704 Holland Farms Way
- 1414 Paulawood Ln
- 1501 Porchlight Ct
- 1104 Danesfield Ct
- 1300 Mooreland Ct
- 1500 Porchlight Ct
- 1100 Danesfield Ct
- 1221 Harvey Johnson Rd
- 1412 Paulawood Ln
- 5613 Holland Church Rd
- 5700 Holland Farms Way
- 1108 Danesfield Ct
- 1505 Porchlight Ct