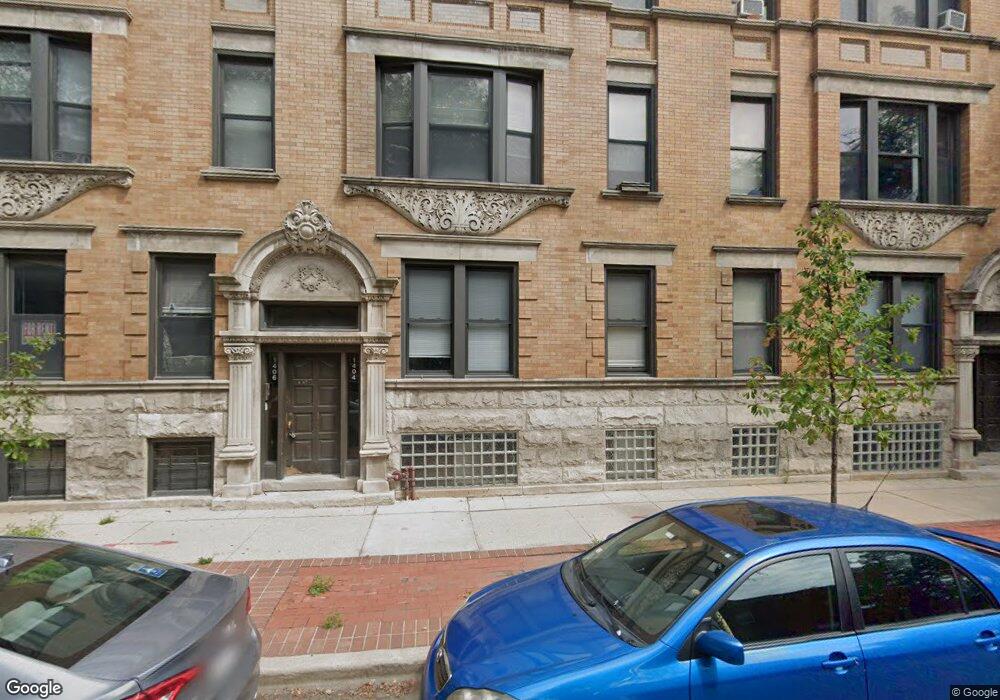
1404 W Flournoy St Unit 14041 Chicago, IL 60607
Little Italy NeighborhoodEstimated Value: $238,000 - $517,203
2
Beds
1
Bath
900
Sq Ft
$356/Sq Ft
Est. Value
About This Home
This home is located at 1404 W Flournoy St Unit 14041, Chicago, IL 60607 and is currently estimated at $320,301, approximately $355 per square foot. 1404 W Flournoy St Unit 14041 is a home located in Cook County with nearby schools including John M. Smyth Elementary I.B. World School and Wells Community Academy High School.
Ownership History
Date
Name
Owned For
Owner Type
Purchase Details
Closed on
May 20, 2025
Sold by
Kap Management Llc
Bought by
Haque 1400 Llc
Current Estimated Value
Home Financials for this Owner
Home Financials are based on the most recent Mortgage that was taken out on this home.
Original Mortgage
$1,413,750
Outstanding Balance
$1,408,916
Interest Rate
6.83%
Mortgage Type
Credit Line Revolving
Estimated Equity
-$1,088,615
Purchase Details
Closed on
May 25, 2016
Sold by
Hoffman Kirk
Bought by
Kap Management Llc
Purchase Details
Closed on
Apr 18, 2008
Sold by
Hoffman Kirk and Kania John
Bought by
Hoffman Kirk
Home Financials for this Owner
Home Financials are based on the most recent Mortgage that was taken out on this home.
Original Mortgage
$725,000
Interest Rate
5.25%
Mortgage Type
Credit Line Revolving
Create a Home Valuation Report for This Property
The Home Valuation Report is an in-depth analysis detailing your home's value as well as a comparison with similar homes in the area
Home Values in the Area
Average Home Value in this Area
Purchase History
| Date | Buyer | Sale Price | Title Company |
|---|---|---|---|
| Haque 1400 Llc | $642,500 | First American Title | |
| Kap Management Llc | -- | Fidelity National Title Comp | |
| Hoffman Kirk | -- | Cti |
Source: Public Records
Mortgage History
| Date | Status | Borrower | Loan Amount |
|---|---|---|---|
| Open | Haque 1400 Llc | $1,413,750 | |
| Previous Owner | Hoffman Kirk | $725,000 |
Source: Public Records
Tax History Compared to Growth
Tax History
| Year | Tax Paid | Tax Assessment Tax Assessment Total Assessment is a certain percentage of the fair market value that is determined by local assessors to be the total taxable value of land and additions on the property. | Land | Improvement |
|---|---|---|---|---|
| 2024 | $5,294 | $18,158 | $2,438 | $15,720 |
| 2023 | $5,160 | $25,004 | $1,480 | $23,524 |
| 2022 | $5,160 | $25,004 | $1,480 | $23,524 |
| 2021 | $5,045 | $25,004 | $1,480 | $23,524 |
| 2020 | $2,728 | $12,207 | $1,480 | $10,727 |
| 2019 | $2,697 | $13,378 | $1,480 | $11,898 |
| 2018 | $2,651 | $13,378 | $1,480 | $11,898 |
| 2017 | $2,470 | $11,437 | $1,306 | $10,131 |
| 2016 | $2,291 | $11,437 | $1,306 | $10,131 |
| 2015 | $2,458 | $13,414 | $1,306 | $12,108 |
| 2014 | $2,120 | $11,429 | $1,110 | $10,319 |
| 2013 | $2,079 | $11,429 | $1,110 | $10,319 |
Source: Public Records
Map
Nearby Homes
- 1402 W Flournoy St Unit 1
- 234 W Polk St Unit 3107
- 234 W Polk St Unit 3303
- 234 W Polk St Unit 3210
- 234 W Polk St Unit 3811
- 234 W Polk St Unit 2611
- 234 W Polk St Unit 2811
- 234 W Polk St Unit 3701
- 234 W Polk St Unit 2412
- 234 W Polk St Unit 2804
- 234 W Polk St Unit 3002
- 234 W Polk St Unit 2905
- 234 W Polk St Unit 3103
- 234 W Polk St Unit 2901
- 234 W Polk St Unit 3706
- 234 W Polk St Unit 2608
- 234 W Polk St Unit 3708
- 234 W Polk St Unit 3704
- 234 W Polk St Unit 2409
- 234 W Polk St Unit 3412
- 1402 W Flournoy St Unit 3
- 1402 W Flournoy St Unit 14023
- 1402 W Flournoy St Unit 14022
- 1402 W Flournoy St Unit 14021
- 1402 W Flournoy St
- 1402 W Flournoy St Unit Anupama Sri Kota
- 1402 W Flournoy St Unit 2
- 1406 W Flournoy St Unit 14063
- 1406 W Flournoy St Unit 14062
- 1406 W Flournoy St Unit 14061
- 1406 W Flournoy St Unit 3
- 1406 W Flournoy St Unit 2
- 1406 W Flournoy St Unit 1
- 1404 W Flournoy St Unit 14043
- 1404 W Flournoy St Unit 14042
- 1404 W Flournoy St Unit 3
- 1404 W Flournoy St Unit 2
- 1404 W Flournoy St Unit 1
- 616 S Loomis St Unit 1
- 616 S Loomis St Unit 6163