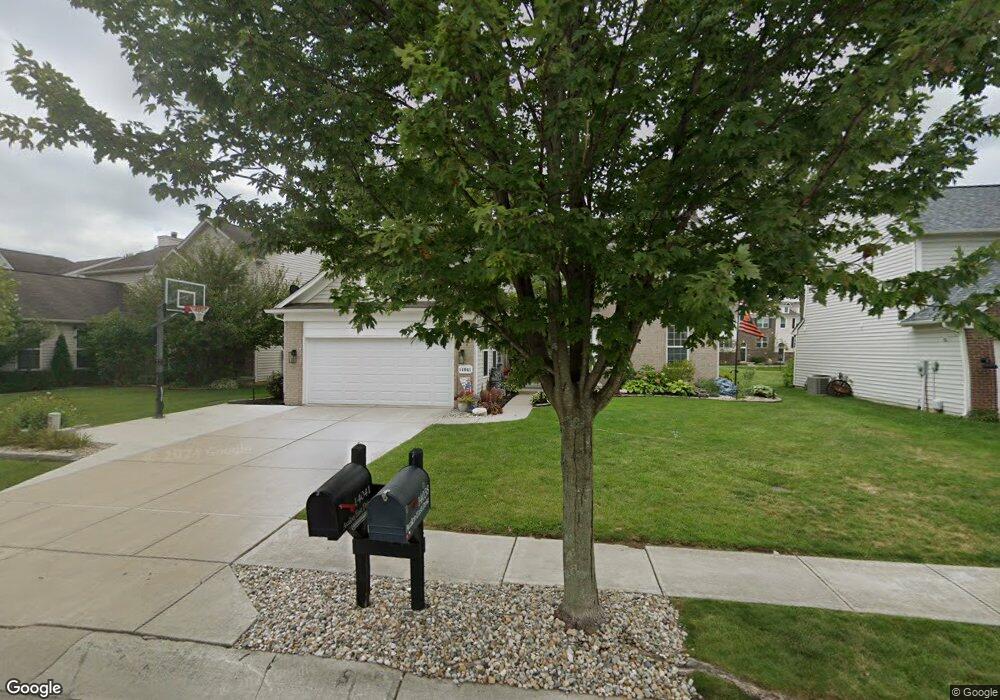
14041 Avalon East Dr Fishers, IN 46037
Estimated Value: $452,958 - $500,000
3
Beds
4
Baths
2,294
Sq Ft
$209/Sq Ft
Est. Value
About This Home
This home is located at 14041 Avalon East Dr, Fishers, IN 46037 and is currently estimated at $478,990, approximately $208 per square foot. 14041 Avalon East Dr is a home located in Hamilton County with nearby schools including Thorpe Creek Elementary School, Hamilton Southeastern Intermediate / Junior High, and Hamilton Southeastern High School.
Ownership History
Date
Name
Owned For
Owner Type
Purchase Details
Closed on
Oct 22, 2024
Sold by
Harris Rebecca and Allen Rebecca
Bought by
Allen Rebecca
Current Estimated Value
Home Financials for this Owner
Home Financials are based on the most recent Mortgage that was taken out on this home.
Original Mortgage
$70,000
Outstanding Balance
$68,173
Interest Rate
6.2%
Mortgage Type
New Conventional
Estimated Equity
$410,817
Purchase Details
Closed on
Jul 28, 2014
Sold by
Sanders Melburn E and Sanders Julie M
Bought by
Harris Rebecca
Home Financials for this Owner
Home Financials are based on the most recent Mortgage that was taken out on this home.
Original Mortgage
$240,350
Interest Rate
4.19%
Mortgage Type
New Conventional
Purchase Details
Closed on
Feb 28, 2005
Sold by
Pulte Homes Of Indiana Llc
Bought by
Sanders Melburn E and Sanders Julie M
Create a Home Valuation Report for This Property
The Home Valuation Report is an in-depth analysis detailing your home's value as well as a comparison with similar homes in the area
Home Values in the Area
Average Home Value in this Area
Purchase History
| Date | Buyer | Sale Price | Title Company |
|---|---|---|---|
| Allen Rebecca | -- | Avenue 365 Lender Services | |
| Harris Rebecca | -- | None Available | |
| Sanders Melburn E | -- | -- |
Source: Public Records
Mortgage History
| Date | Status | Borrower | Loan Amount |
|---|---|---|---|
| Open | Allen Rebecca | $70,000 | |
| Previous Owner | Harris Rebecca | $240,350 |
Source: Public Records
Tax History Compared to Growth
Tax History
| Year | Tax Paid | Tax Assessment Tax Assessment Total Assessment is a certain percentage of the fair market value that is determined by local assessors to be the total taxable value of land and additions on the property. | Land | Improvement |
|---|---|---|---|---|
| 2024 | $4,185 | $383,800 | $67,900 | $315,900 |
| 2023 | $4,185 | $369,900 | $67,900 | $302,000 |
| 2022 | $3,937 | $329,300 | $67,900 | $261,400 |
| 2021 | $3,592 | $301,200 | $67,900 | $233,300 |
| 2020 | $3,466 | $287,100 | $67,900 | $219,200 |
| 2019 | $3,355 | $278,100 | $45,000 | $233,100 |
| 2018 | $3,160 | $261,700 | $45,000 | $216,700 |
| 2017 | $3,002 | $252,800 | $42,900 | $209,900 |
| 2016 | $5,735 | $251,700 | $42,900 | $208,800 |
| 2014 | $2,279 | $213,900 | $42,900 | $171,000 |
| 2013 | $2,279 | $207,200 | $42,900 | $164,300 |
Source: Public Records
Map
Nearby Homes
- 12706 Hannah Hill Rd
- 12748 Tamworth Dr
- 12680 Tamworth Dr
- 14156 Avalon Dr E
- 12878 Ari Ln
- 13896 Willesden Cir
- 12880 Oxbridge Place
- 12637 Watford Way
- 14332 Eddington Place
- 13019 Pinner Ave
- 13935 Canonbury Way
- 14514 Glapthorn Rd
- 14584 Hinton Dr
- 13008 Overview Dr
- 12318 Whispering Breeze Dr
- 12985 Saxony Blvd
- 13616 Whitten Dr N
- 14402 Wolverton Way
- 12438 Hawks Landing Dr
- 12308 Hawks Nest Dr
- 14033 Avalon East Dr
- 14027 Avalon Dr E
- 14041 Avalon Dr E
- 14027 Avalon East Dr
- 14049 Avalon East Dr
- 14030 Avalon East Dr
- 14049 Avalon Dr E
- 14021 Avalon Dr E
- 14038 Avalon East Dr
- 14021 Avalon East Dr
- 14026 Avalon East Dr
- 14038 Avalon Dr E
- 14026 Avalon Dr E
- 14020 Avalon East Dr
- 14055 Avalon Dr E
- 14013 Avalon East Dr
- 14013 Avalon Dr E
- 14050 Avalon Dr E
- 14055 Avalon East Dr
- 14050 Avalon East Dr