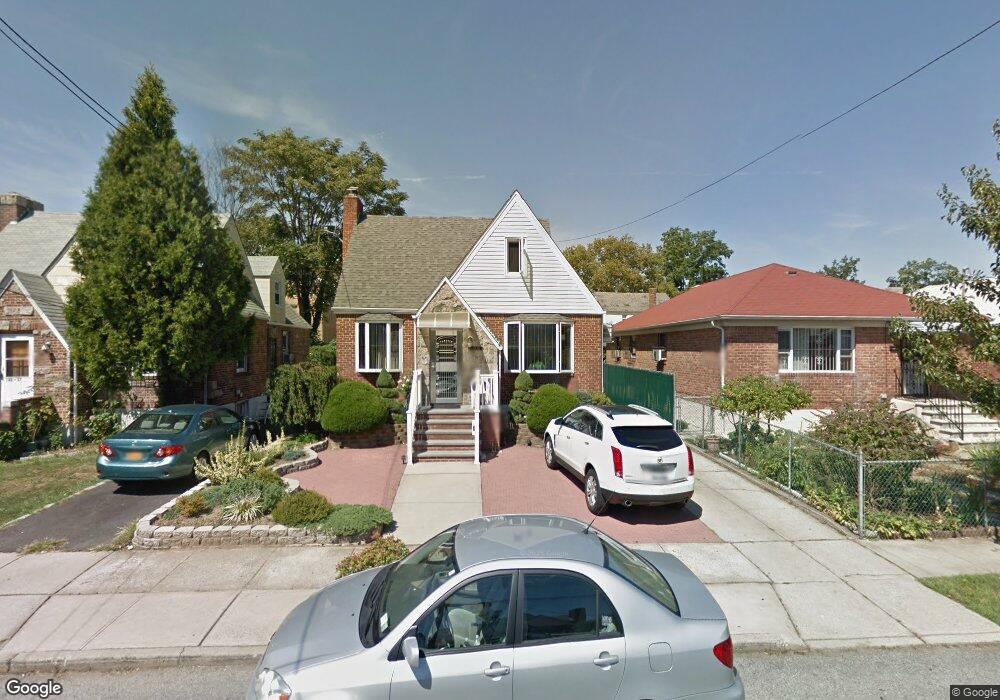
14041 Poplar Ave Flushing, NY 11355
Flushing NeighborhoodEstimated Value: $1,199,733 - $1,676,000
--
Bed
--
Bath
1,651
Sq Ft
$841/Sq Ft
Est. Value
About This Home
This home is located at 14041 Poplar Ave, Flushing, NY 11355 and is currently estimated at $1,388,433, approximately $840 per square foot. 14041 Poplar Ave is a home located in Queens County with nearby schools including P.S. 024 Andrew Jackson School, Rachel Carson I.S. 237Q, and Francis Lewis High School.
Ownership History
Date
Name
Owned For
Owner Type
Purchase Details
Closed on
Dec 18, 2014
Sold by
Chan Choi Yui
Bought by
You Jian Yun
Current Estimated Value
Home Financials for this Owner
Home Financials are based on the most recent Mortgage that was taken out on this home.
Original Mortgage
$400,000
Outstanding Balance
$306,397
Interest Rate
3.92%
Mortgage Type
New Conventional
Estimated Equity
$1,082,036
Purchase Details
Closed on
May 9, 2008
Sold by
Kelly Aidan and Kelly Lisa
Bought by
Chan Choi Yui
Purchase Details
Closed on
Jul 23, 2004
Sold by
Dinapoli Barbara and Disanto Kathleen
Bought by
Kelly Aidan
Home Financials for this Owner
Home Financials are based on the most recent Mortgage that was taken out on this home.
Original Mortgage
$80,000
Interest Rate
6.2%
Purchase Details
Closed on
Oct 28, 1999
Sold by
Greene Catherine
Bought by
Dinapoli Barbara and Disanto Kathleen
Create a Home Valuation Report for This Property
The Home Valuation Report is an in-depth analysis detailing your home's value as well as a comparison with similar homes in the area
Home Values in the Area
Average Home Value in this Area
Purchase History
| Date | Buyer | Sale Price | Title Company |
|---|---|---|---|
| You Jian Yun | $980,000 | -- | |
| Chan Choi Yui | $700,000 | -- | |
| Chan Choi Yui | $700,000 | -- | |
| Kelly Aidan | $400,000 | -- | |
| Kelly Aidan | $400,000 | -- | |
| Dinapoli Barbara | -- | -- | |
| Dinapoli Barbara | -- | -- |
Source: Public Records
Mortgage History
| Date | Status | Borrower | Loan Amount |
|---|---|---|---|
| Open | You Jian Yun | $400,000 | |
| Previous Owner | Kelly Aidan | $80,000 | |
| Previous Owner | Kelly Aidan | $320,000 |
Source: Public Records
Tax History Compared to Growth
Tax History
| Year | Tax Paid | Tax Assessment Tax Assessment Total Assessment is a certain percentage of the fair market value that is determined by local assessors to be the total taxable value of land and additions on the property. | Land | Improvement |
|---|---|---|---|---|
| 2025 | $9,238 | $48,756 | $14,989 | $33,767 |
| 2024 | $9,238 | $45,996 | $15,106 | $30,890 |
| 2023 | $8,716 | $43,394 | $12,831 | $30,563 |
| 2022 | $8,813 | $75,900 | $21,360 | $54,540 |
| 2021 | $9,063 | $69,060 | $21,360 | $47,700 |
| 2020 | $8,600 | $70,920 | $21,360 | $49,560 |
| 2019 | $8,018 | $67,140 | $21,360 | $45,780 |
| 2018 | $7,372 | $36,162 | $9,842 | $26,320 |
| 2017 | $7,372 | $36,162 | $12,414 | $23,748 |
| 2016 | $7,174 | $36,162 | $12,414 | $23,748 |
| 2015 | $4,115 | $33,858 | $15,027 | $18,831 |
| 2014 | $4,115 | $31,942 | $14,914 | $17,028 |
Source: Public Records
Map
Nearby Homes
- 14014 Poplar Ave
- 140-03 Poplar Ave
- 140-50 Quince Ave
- 14014 Negundo Ave
- 52-05 Robinson St
- 140-24 Quince Ave
- 50-16 Kissena Blvd
- 52-06 Bowne St
- 140-19 Rose Ave
- 14324 Quince Ave
- 14335 Poplar Ave
- 152-10 Peck Ave
- 15110 Peck Ave
- 54-13 152nd St
- 54-23 153rd St
- 54-25 152nd St
- 46-40 Kissena Blvd
- 54-36 152nd St
- 54-30 Kissena Blvd
- 137-38 Kalmia Ave
- 14037 Poplar Ave
- 14045 Poplar Ave
- 140-37 Poplar Ave
- 14033 Poplar Ave
- 14049 Poplar Ave
- 14033 Poplar Ave
- 14040 Oak Ave
- 14046 Oak Ave
- 14036 Oak Ave
- 14029 Poplar Ave
- 14051 Poplar Ave
- 14050 Oak Ave
- 14029 Poplar Ave
- 140-54 Oak Ave
- 140-32 Oak Ave Unit 1FL
- 14032 Oak Ave
- 14038 Poplar Ave
- 14054 Oak Ave
- 140-40 Oak Ave Unit 2 Flr
- 14042 Poplar Ave