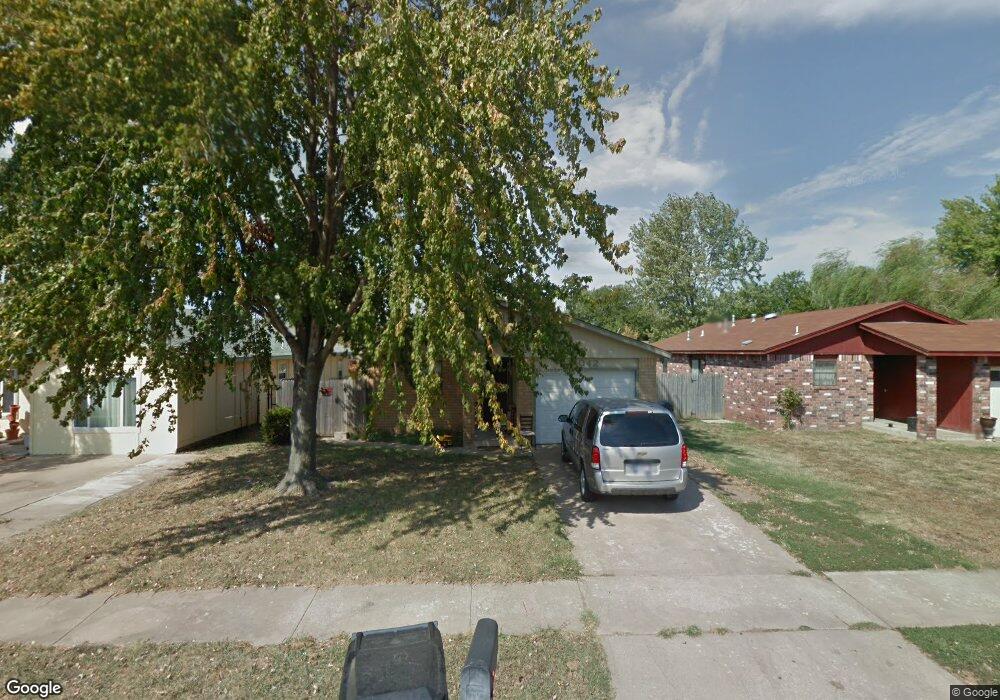
14042 S Hickory Place Glenpool, OK 74033
Estimated Value: $162,363 - $204,000
--
Bed
2
Baths
1,212
Sq Ft
$149/Sq Ft
Est. Value
About This Home
This home is located at 14042 S Hickory Place, Glenpool, OK 74033 and is currently estimated at $180,091, approximately $148 per square foot. 14042 S Hickory Place is a home located in Tulsa County with nearby schools including Glenpool Elementary School, Glenpool Middle School, and Glenpool High School.
Ownership History
Date
Name
Owned For
Owner Type
Purchase Details
Closed on
Oct 29, 2007
Sold by
Moura Properties Inc
Bought by
Moura Jose M and Moura Noemia C
Current Estimated Value
Purchase Details
Closed on
Apr 7, 2005
Sold by
American General Finance Inc
Bought by
Moura Properties Inc
Purchase Details
Closed on
Dec 6, 2004
Sold by
Nix Vernita J
Bought by
American General Finance Inc
Purchase Details
Closed on
Mar 1, 1984
Create a Home Valuation Report for This Property
The Home Valuation Report is an in-depth analysis detailing your home's value as well as a comparison with similar homes in the area
Home Values in the Area
Average Home Value in this Area
Purchase History
| Date | Buyer | Sale Price | Title Company |
|---|---|---|---|
| Moura Jose M | -- | First American Title & Abstr | |
| Moura Properties Inc | $62,000 | First American Title & Abstr | |
| American General Finance Inc | $55,000 | -- | |
| -- | $7,000 | -- |
Source: Public Records
Tax History Compared to Growth
Tax History
| Year | Tax Paid | Tax Assessment Tax Assessment Total Assessment is a certain percentage of the fair market value that is determined by local assessors to be the total taxable value of land and additions on the property. | Land | Improvement |
|---|---|---|---|---|
| 2024 | $1,295 | $11,614 | $1,636 | $9,978 |
| 2023 | $1,295 | $11,060 | $1,691 | $9,369 |
| 2022 | $1,214 | $10,534 | $2,307 | $8,227 |
| 2021 | $1,174 | $10,032 | $2,197 | $7,835 |
| 2020 | $1,127 | $9,555 | $2,093 | $7,462 |
| 2019 | $1,080 | $9,100 | $1,993 | $7,107 |
| 2018 | $1,024 | $8,666 | $1,898 | $6,768 |
| 2017 | $955 | $8,254 | $1,808 | $6,446 |
| 2016 | $964 | $8,254 | $1,808 | $6,446 |
| 2015 | $950 | $8,254 | $1,808 | $6,446 |
| 2014 | $909 | $7,786 | $1,705 | $6,081 |
Source: Public Records
Map
Nearby Homes
- 13936 S Ironwood Place
- 14105 S Hickory Place
- 750 E 139th Place
- 14111 S Hickory Place
- 745 E 139th Place S
- 642 E 138th Place
- 780 E 139th Place
- 797 E 142nd Place
- 687 E 142nd Place
- 655 E 142nd Place
- 660 E 143rd St
- 243 E 141st St
- 475 E 138th Place
- 1057 E 144th St
- 14324 S Dogwood St
- 265 E Glenpool Blvd
- 13846 S Nyssa Place
- 1122 E 144th Place
- 14447 S Oklahoma Blvd
- 590 E 134th Place
- 14048 S Hickory Place
- 14030 S Hickory Place
- 14054 S Hickory Place
- 14018 S Hickory Place
- 14021 S Hickory St
- 13996 S Hickory Place
- 14019 S Hickory St
- 701 E 141st St
- 14073 S Hickory St
- 14027 S Hickory St
- 14027 S Hickory Place
- 13992 S Hickory Place
- 14045 S Hickory Place
- 14027 S Hickory Place
- 14053 S Hickory Place
- 13997 S Hickory St
- 14009 S Hickory Place
- 719 E 141st St
- 13980 S Hickory Place
- 13997 S Hickory Place