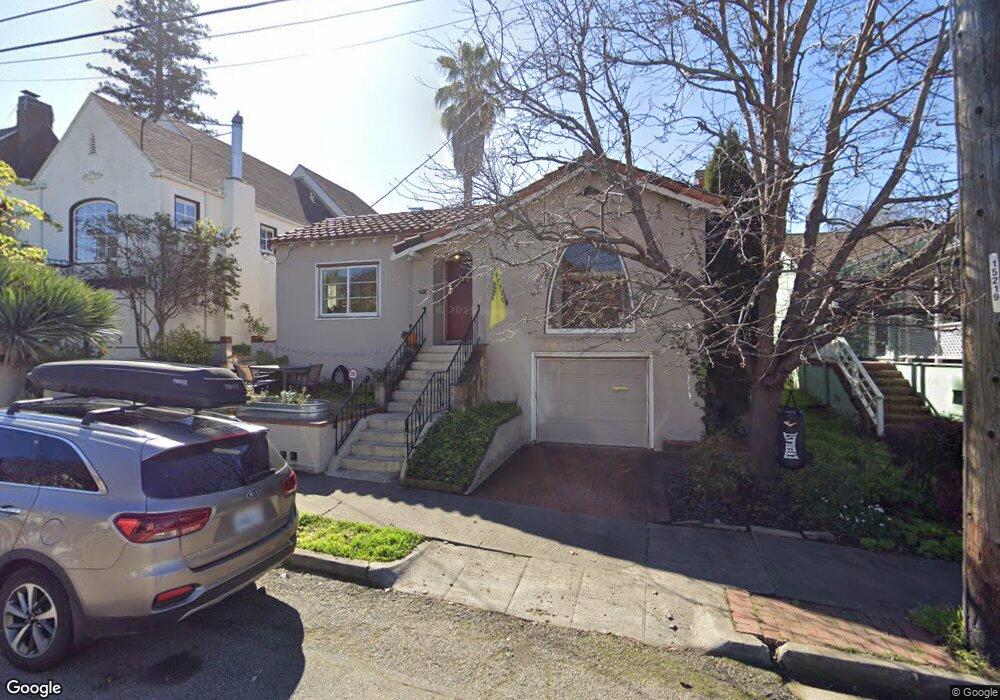
1405 Allman St Oakland, CA 94602
Glenview NeighborhoodEstimated Value: $893,000 - $1,229,000
2
Beds
2
Baths
1,419
Sq Ft
$739/Sq Ft
Est. Value
About This Home
This home is located at 1405 Allman St, Oakland, CA 94602 and is currently estimated at $1,048,243, approximately $738 per square foot. 1405 Allman St is a home located in Alameda County with nearby schools including Glenview Elementary School, Edna Brewer Middle School, and Oakland High School.
Ownership History
Date
Name
Owned For
Owner Type
Purchase Details
Closed on
Sep 4, 2014
Sold by
Green Donald K
Bought by
Trale Mitchell C and Trale Larisa H
Current Estimated Value
Home Financials for this Owner
Home Financials are based on the most recent Mortgage that was taken out on this home.
Original Mortgage
$625,500
Outstanding Balance
$477,975
Interest Rate
4.09%
Mortgage Type
New Conventional
Estimated Equity
$570,268
Purchase Details
Closed on
May 5, 2003
Sold by
Bourbon Barry
Bought by
Green Donald K
Home Financials for this Owner
Home Financials are based on the most recent Mortgage that was taken out on this home.
Original Mortgage
$170,000
Interest Rate
5.84%
Purchase Details
Closed on
Sep 2, 1999
Sold by
Simon Sarah R 1992 Trust and Ethel
Bought by
Bourbon Barry
Home Financials for this Owner
Home Financials are based on the most recent Mortgage that was taken out on this home.
Original Mortgage
$191,900
Interest Rate
7.66%
Create a Home Valuation Report for This Property
The Home Valuation Report is an in-depth analysis detailing your home's value as well as a comparison with similar homes in the area
Home Values in the Area
Average Home Value in this Area
Purchase History
| Date | Buyer | Sale Price | Title Company |
|---|---|---|---|
| Trale Mitchell C | $705,000 | Old Republic Title Company | |
| Green Donald K | $519,000 | Placer Title Company | |
| Bourbon Barry | $241,000 | North American Title Co |
Source: Public Records
Mortgage History
| Date | Status | Borrower | Loan Amount |
|---|---|---|---|
| Open | Trale Mitchell C | $625,500 | |
| Previous Owner | Green Donald K | $170,000 | |
| Previous Owner | Bourbon Barry | $191,900 | |
| Closed | Bourbon Barry | $25,000 |
Source: Public Records
Tax History Compared to Growth
Tax History
| Year | Tax Paid | Tax Assessment Tax Assessment Total Assessment is a certain percentage of the fair market value that is determined by local assessors to be the total taxable value of land and additions on the property. | Land | Improvement |
|---|---|---|---|---|
| 2025 | $12,229 | $840,275 | $254,182 | $593,093 |
| 2024 | $12,229 | $823,665 | $249,199 | $581,466 |
| 2023 | $12,876 | $814,380 | $244,314 | $570,066 |
| 2022 | $12,566 | $791,411 | $239,523 | $558,888 |
| 2021 | $12,076 | $775,761 | $234,828 | $547,933 |
| 2020 | $11,944 | $774,738 | $232,421 | $542,317 |
| 2019 | $11,534 | $759,552 | $227,865 | $531,687 |
| 2018 | $11,293 | $744,662 | $223,398 | $521,264 |
| 2017 | $10,876 | $730,061 | $219,018 | $511,043 |
| 2016 | $10,554 | $715,750 | $214,725 | $501,025 |
| 2015 | $10,500 | $705,000 | $211,500 | $493,500 |
| 2014 | $5,528 | $325,697 | $179,015 | $146,682 |
Source: Public Records
Map
Nearby Homes
- 1407 Allman St
- 1397 Allman St
- 1415 Allman St
- 1442 Excelsior Ave
- 1421 Allman St
- 1450 Excelsior Ave
- 1436 Excelsior Ave
- 1400 Allman St
- 1406 Allman St
- 1398 Allman St
- 1414 Allman St
- 1427 Allman St
- 1420 Allman St
- 1456 Excelsior Ave
- 1426 Allman St
- 1433 Allman St
- 1460 Excelsior Ave
- 1442 Allman St
- 1411 E 38th St
- 1405 E 38th St