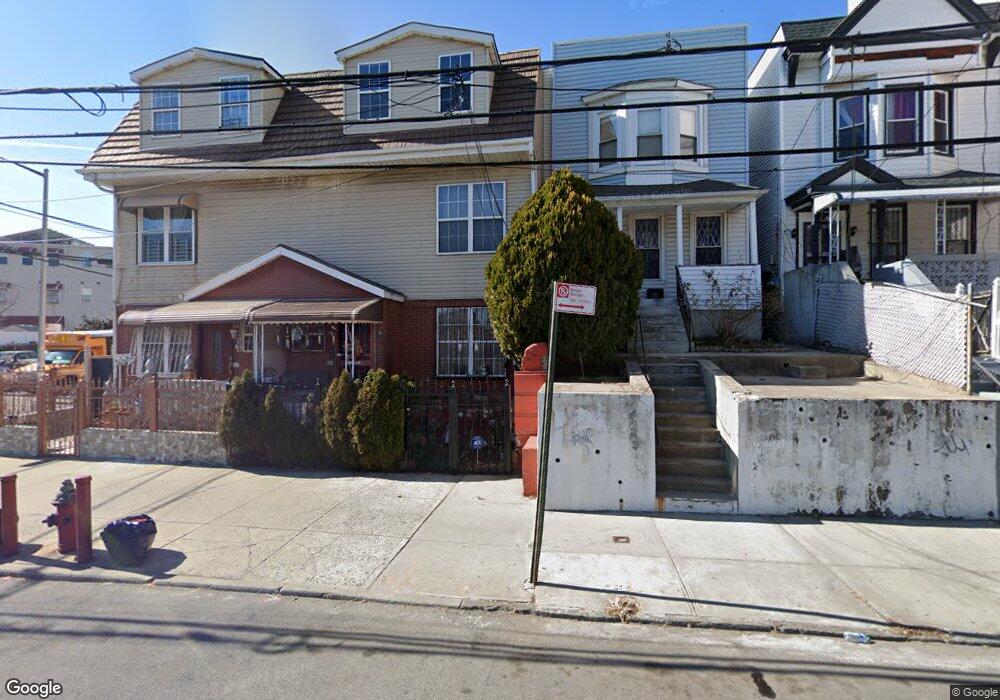
1405 Bryant Ave Bronx, NY 10459
Crotona Park East NeighborhoodEstimated Value: $548,332 - $856,000
Studio
--
Bath
1,515
Sq Ft
$422/Sq Ft
Est. Value
About This Home
This home is located at 1405 Bryant Ave, Bronx, NY 10459 and is currently estimated at $639,083, approximately $421 per square foot. 1405 Bryant Ave is a home located in Bronx County with nearby schools including P.S. 066 School of Higher Expectations, P.S. 214, and Bold Charter School.
Ownership History
Date
Name
Owned For
Owner Type
Purchase Details
Closed on
Feb 14, 2006
Sold by
Better Homes Depot Inc
Bought by
Lamar Gregory
Current Estimated Value
Home Financials for this Owner
Home Financials are based on the most recent Mortgage that was taken out on this home.
Original Mortgage
$341,300
Outstanding Balance
$190,699
Interest Rate
6.17%
Mortgage Type
Purchase Money Mortgage
Estimated Equity
$448,384
Purchase Details
Closed on
Apr 22, 2005
Sold by
Better Homes Depot Of The Bronx Inc
Bought by
Better Homes Depot Inc
Purchase Details
Closed on
Apr 12, 2005
Sold by
Reid Esq Thomas H
Bought by
Better Homes Depot Of The Bronx Inc
Create a Home Valuation Report for This Property
The Home Valuation Report is an in-depth analysis detailing your home's value as well as a comparison with similar homes in the area
Home Values in the Area
Average Home Value in this Area
Purchase History
| Date | Buyer | Sale Price | Title Company |
|---|---|---|---|
| Lamar Gregory | $344,000 | -- | |
| Lamar Gregory | $344,000 | -- | |
| Better Homes Depot Inc | -- | -- | |
| Better Homes Depot Inc | -- | -- | |
| Better Homes Depot Of The Bronx Inc | $170,000 | -- | |
| Better Homes Depot Of The Bronx Inc | $170,000 | -- |
Source: Public Records
Mortgage History
| Date | Status | Borrower | Loan Amount |
|---|---|---|---|
| Open | Lamar Gregory | $341,300 | |
| Closed | Lamar Gregory | $341,300 |
Source: Public Records
Tax History
| Year | Tax Paid | Tax Assessment Tax Assessment Total Assessment is a certain percentage of the fair market value that is determined by local assessors to be the total taxable value of land and additions on the property. | Land | Improvement |
|---|---|---|---|---|
| 2025 | $2,312 | $11,750 | $2,846 | $8,904 |
| 2024 | $2,312 | $11,510 | $3,321 | $8,189 |
| 2023 | $2,214 | $10,901 | $3,195 | $7,706 |
| 2022 | $2,062 | $32,940 | $8,880 | $24,060 |
| 2021 | $2,061 | $30,120 | $8,880 | $21,240 |
| 2020 | $2,073 | $26,160 | $8,880 | $17,280 |
| 2019 | $2,007 | $21,060 | $8,880 | $12,180 |
| 2018 | $1,852 | $9,084 | $3,474 | $5,610 |
| 2017 | $1,755 | $8,607 | $4,136 | $4,471 |
| 2016 | $1,631 | $8,160 | $3,986 | $4,174 |
| 2015 | $979 | $8,160 | $2,978 | $5,182 |
| 2014 | $979 | $7,994 | $3,499 | $4,495 |
Source: Public Records
Map
Nearby Homes
- 1210 Vyse Ave
- 1204 Vyse Ave
- 1456 Bryant Ave
- 1180 Vyse Ave
- 1495 Longfellow Ave
- 1361 Intervale Ave
- 1538 Hoe Ave
- 1124 Fox St
- 837 Jennings St
- 1321 Bristow St
- 895 E 172nd St
- 1241 Intervale Ave
- 829 Jennings St
- 1552 Bryant Ave
- 1333 Bristow St
- 1568 Bryant Ave
- 1567 Longfellow Ave
- 1333 Chisholm St
- 1238 Colgate Ave
- 1670 Longfellow Ave Unit 6J
- 1407 Bryant Ave
- 1403 Bryant Ave
- 1409 Bryant Ave
- 1409 Bryant Ave Unit 2R
- 1409 Bryant Ave
- 1409 Bryant Ave Unit 1-B
- 1409 Bryant Ave Unit 4-C
- 1409 Bryant Ave Unit 3-C
- 1409 Bryant Ave Unit 2-B
- 1409 Bryant Ave Unit 1-A
- 1401 Bryant Ave
- 1411 Bryant Ave
- 1415 Bryant Ave
- 1404 Vyse Ave
- 1402 Vyse Ave
- 1406 Vyse Ave
- 1408 Vyse Ave
- 1400 Vyse Ave
- 1410 Vyse Ave
- 1414 Vyse Ave
Your Personal Tour Guide
Ask me questions while you tour the home.