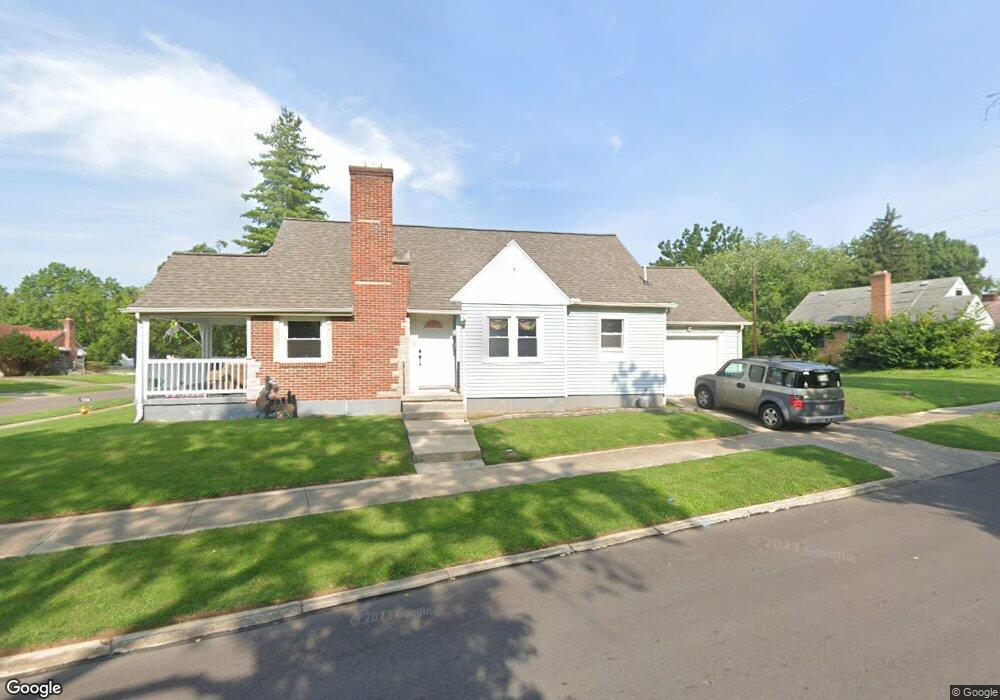
1405 Canfield Ave Dayton, OH 45406
Cornell Heights NeighborhoodEstimated Value: $102,000 - $169,782
3
Beds
2
Baths
1,150
Sq Ft
$119/Sq Ft
Est. Value
About This Home
This home is located at 1405 Canfield Ave, Dayton, OH 45406 and is currently estimated at $137,196, approximately $119 per square foot. 1405 Canfield Ave is a home located in Montgomery County with nearby schools including Valerie Elementary School, Dayton Leadership Academies, and Deca Prep.
Ownership History
Date
Name
Owned For
Owner Type
Purchase Details
Closed on
May 17, 2022
Sold by
Ramcor Properties Llc
Bought by
Bryant Jaymie R and Bryant Joshua
Current Estimated Value
Home Financials for this Owner
Home Financials are based on the most recent Mortgage that was taken out on this home.
Original Mortgage
$135,800
Outstanding Balance
$128,844
Interest Rate
5.11%
Mortgage Type
New Conventional
Estimated Equity
$8,352
Purchase Details
Closed on
Sep 28, 2021
Sold by
Barnette Dion S
Bought by
Ramcor Properties Llc
Purchase Details
Closed on
Feb 10, 2017
Sold by
Barnette Shelley A
Bought by
Barnette Dion S
Purchase Details
Closed on
Jul 29, 2016
Sold by
City Of Dayton
Bought by
Barnette Shelley A
Purchase Details
Closed on
Apr 29, 2016
Sold by
Jackson Angela
Bought by
City Of Dayton
Purchase Details
Closed on
Sep 7, 1995
Sold by
Coker Willis B
Bought by
Nacnic Investments Inc
Create a Home Valuation Report for This Property
The Home Valuation Report is an in-depth analysis detailing your home's value as well as a comparison with similar homes in the area
Home Values in the Area
Average Home Value in this Area
Purchase History
| Date | Buyer | Sale Price | Title Company |
|---|---|---|---|
| Bryant Jaymie R | -- | None Listed On Document | |
| Ramcor Properties Llc | $46,000 | None Available | |
| Barnette Dion S | -- | None Available | |
| Barnette Shelley A | -- | None Available | |
| City Of Dayton | -- | None Available | |
| Nacnic Investments Inc | -- | -- |
Source: Public Records
Mortgage History
| Date | Status | Borrower | Loan Amount |
|---|---|---|---|
| Open | Bryant Jaymie R | $135,800 |
Source: Public Records
Tax History Compared to Growth
Tax History
| Year | Tax Paid | Tax Assessment Tax Assessment Total Assessment is a certain percentage of the fair market value that is determined by local assessors to be the total taxable value of land and additions on the property. | Land | Improvement |
|---|---|---|---|---|
| 2024 | $503 | $8,660 | $3,490 | $5,170 |
| 2023 | $503 | $8,660 | $3,490 | $5,170 |
| 2022 | $661 | $8,660 | $3,490 | $5,170 |
| 2021 | $657 | $8,660 | $3,490 | $5,170 |
| 2020 | $656 | $8,660 | $3,490 | $5,170 |
| 2019 | $741 | $8,660 | $3,490 | $5,170 |
| 2018 | $742 | $8,660 | $3,490 | $5,170 |
| 2017 | $1,215 | $15,090 | $3,490 | $11,600 |
| 2016 | $1,275 | $15,090 | $3,490 | $11,600 |
| 2015 | $1,679 | $15,090 | $3,490 | $11,600 |
| 2014 | $1,679 | $15,090 | $3,490 | $11,600 |
| 2012 | -- | $19,670 | $4,350 | $15,320 |
Source: Public Records
Map
Nearby Homes
- 1365 Alcott Dr
- 1460 Kipling Dr
- 1251 Canfield Ave
- 3007 Cornell Dr
- 3108 Campus Dr
- 1419 Lexington Ave
- 1641 Kipling Dr
- 1643 Earlham Dr
- 1656 Tennyson Ave
- 1045 Philadelphia Dr
- 1676 Tennyson Ave
- 1812 Haverhill Dr
- 1628 Philadelphia Dr
- 1124 Seneca Dr
- 1200 Wilson Dr
- 3231 Harvard Blvd
- 3644 Karwin Dr Unit 3638
- 1716 Parkhill Dr
- 3637 Stanford Place Unit 3631
- 1627 Harold Dr Unit 1621
- 3111 Princeton Dr
- 1400 Canfield Ave
- 1417 Canfield Ave
- 3115 Princeton Dr
- 3017 Princeton Dr
- 1420 Canfield Ave
- 1421 Canfield Ave
- 3121 Princeton Dr
- 3015 Princeton Dr
- 3100 Princeton Dr
- 1425 Canfield Ave
- 3108 Princeton Dr
- 3112 Princeton Dr
- 3125 Princeton Dr
- 1358 Canfield Ave
- 1424 Canfield Ave
- 3116 Princeton Dr
- 1416 Shaftesbury Rd
- 1429 Canfield Ave
- 1402 Shaftesbury Rd