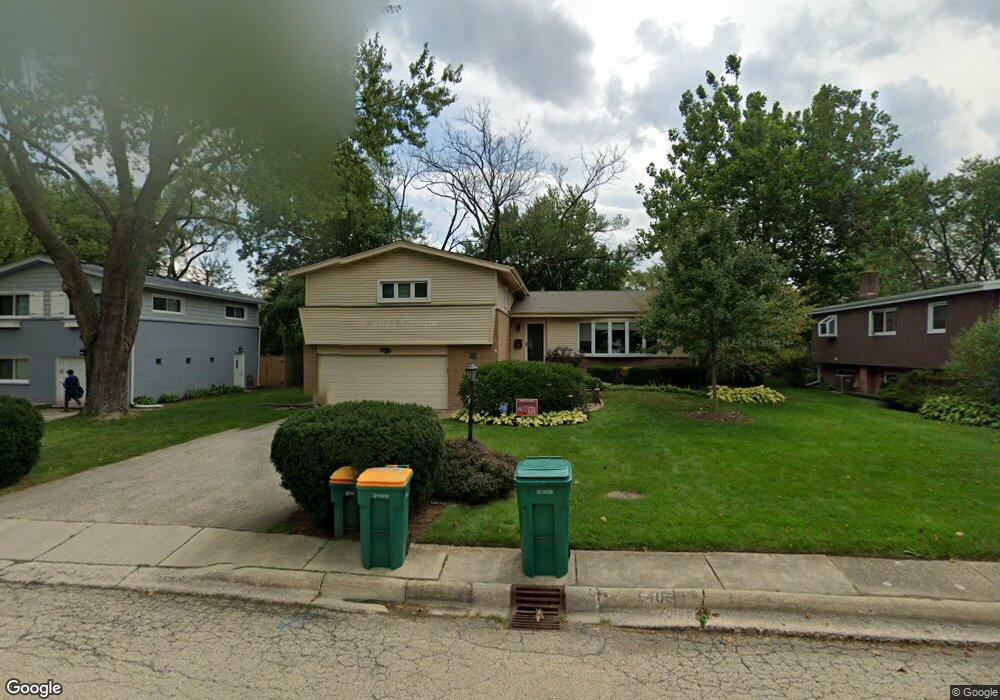
1405 Charing Cross Rd Deerfield, IL 60015
Deerfield Park NeighborhoodEstimated Value: $580,000 - $682,000
4
Beds
3
Baths
2,441
Sq Ft
$265/Sq Ft
Est. Value
About This Home
This home is located at 1405 Charing Cross Rd, Deerfield, IL 60015 and is currently estimated at $647,936, approximately $265 per square foot. 1405 Charing Cross Rd is a home located in Lake County with nearby schools including Wilmot Elementary School, Charles J Caruso Middle School, and Deerfield High School.
Ownership History
Date
Name
Owned For
Owner Type
Purchase Details
Closed on
Oct 8, 2021
Sold by
Allen Monty D and Allen Dawn A
Bought by
Allen Monty D and Allen Dawn A
Current Estimated Value
Purchase Details
Closed on
Nov 30, 1998
Sold by
Keidan Martin J and Keidan Faith A
Bought by
Allen Monty D and Allen Dawn A
Home Financials for this Owner
Home Financials are based on the most recent Mortgage that was taken out on this home.
Original Mortgage
$227,000
Interest Rate
6.83%
Create a Home Valuation Report for This Property
The Home Valuation Report is an in-depth analysis detailing your home's value as well as a comparison with similar homes in the area
Home Values in the Area
Average Home Value in this Area
Purchase History
| Date | Buyer | Sale Price | Title Company |
|---|---|---|---|
| Allen Monty D | -- | None Listed On Document | |
| Allen Monty D | $310,000 | -- |
Source: Public Records
Mortgage History
| Date | Status | Borrower | Loan Amount |
|---|---|---|---|
| Previous Owner | Allen Monty D | $227,000 | |
| Closed | Allen Monty D | $52,000 |
Source: Public Records
Tax History Compared to Growth
Tax History
| Year | Tax Paid | Tax Assessment Tax Assessment Total Assessment is a certain percentage of the fair market value that is determined by local assessors to be the total taxable value of land and additions on the property. | Land | Improvement |
|---|---|---|---|---|
| 2024 | $14,316 | $171,957 | $48,561 | $123,396 |
| 2023 | $14,945 | $160,090 | $46,604 | $113,486 |
| 2022 | $14,945 | $163,711 | $50,057 | $113,654 |
| 2021 | $14,097 | $157,840 | $48,262 | $109,578 |
| 2020 | $13,558 | $158,173 | $48,364 | $109,809 |
| 2019 | $13,248 | $157,905 | $48,282 | $109,623 |
| 2018 | $11,115 | $150,835 | $51,174 | $99,661 |
| 2017 | $11,026 | $150,354 | $51,011 | $99,343 |
| 2016 | $10,717 | $144,668 | $49,082 | $95,586 |
| 2015 | $10,487 | $135,928 | $46,117 | $89,811 |
| 2014 | $9,248 | $109,507 | $46,447 | $63,060 |
| 2012 | $9,030 | $108,541 | $46,037 | $62,504 |
Source: Public Records
Map
Nearby Homes
- 677 Timber Hill Rd
- 517 Appletree Ln
- 1505 Hackberry Rd
- 505 Susan Ln
- 816 Appletree Ln
- 245 Kenmore Ave
- 312 Pine St
- 730 Castlewood Ln
- 1038 Brookside Ln
- 745 Price Ln
- 926 Cedar St
- 1009 Central Ave
- 956 Brookside Ln
- 934 Wayne Ave
- 56 Birchwood Ave
- 904 Forest Ave
- 1103 Hazel Ave
- 19 Burning Tree Ln
- 435 Elm St Unit 4G
- 441 Elm St Unit 3A
- 1335 Charing Cross Rd
- 1406 Central Ave
- 1400 Central Ave
- 1321 Charing Cross Rd
- 1410 Central Ave
- 1415 Charing Cross Rd Unit 4
- 1334 Central Ave
- 1400 Charing Cross Rd
- 1406 Charing Cross Rd
- 1330 Charing Cross Rd
- 1416 Central Ave
- 1414 Charing Cross Rd
- 1330 Central Ave
- 1319 Charing Cross Rd
- 1425 Charing Cross Rd
- 630 Timber Hill Rd
- 1420 Central Ave
- 615 Indian Hill Rd
- 619 Indian Hill Ct
- 1324 Central Ave