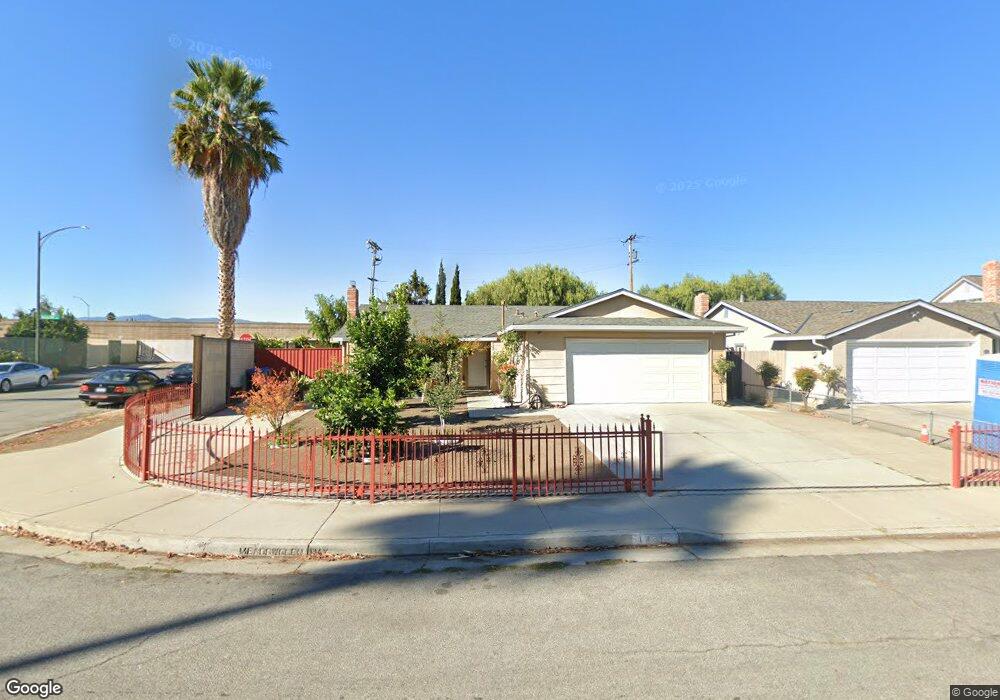
1405 Meadow Glen Way San Jose, CA 95121
Dove Hill NeighborhoodEstimated Value: $1,195,336 - $1,661,000
3
Beds
2
Baths
1,320
Sq Ft
$1,011/Sq Ft
Est. Value
About This Home
This home is located at 1405 Meadow Glen Way, San Jose, CA 95121 and is currently estimated at $1,334,834, approximately $1,011 per square foot. 1405 Meadow Glen Way is a home located in Santa Clara County with nearby schools including John J. Montgomery Elementary School, George V. Leyva Intermediate School, and Silver Creek High School.
Ownership History
Date
Name
Owned For
Owner Type
Purchase Details
Closed on
Aug 8, 2000
Sold by
Vanvandang Tu Van
Bought by
Vanvandang Tu Van and Le Huynh Dung
Current Estimated Value
Home Financials for this Owner
Home Financials are based on the most recent Mortgage that was taken out on this home.
Original Mortgage
$255,000
Outstanding Balance
$92,916
Interest Rate
8.29%
Estimated Equity
$1,241,918
Purchase Details
Closed on
Feb 4, 1994
Sold by
Vanvandang Hung Van
Bought by
Trang Hoa Ngoc
Home Financials for this Owner
Home Financials are based on the most recent Mortgage that was taken out on this home.
Original Mortgage
$148,000
Interest Rate
7.24%
Purchase Details
Closed on
Feb 3, 1994
Sold by
Guaydacan Andrew D and Guaydacan Rebecca
Bought by
Trang Hoa Ngoc and Dang Tu Van
Home Financials for this Owner
Home Financials are based on the most recent Mortgage that was taken out on this home.
Original Mortgage
$148,000
Interest Rate
7.24%
Create a Home Valuation Report for This Property
The Home Valuation Report is an in-depth analysis detailing your home's value as well as a comparison with similar homes in the area
Home Values in the Area
Average Home Value in this Area
Purchase History
| Date | Buyer | Sale Price | Title Company |
|---|---|---|---|
| Vanvandang Tu Van | -- | Financial Title Company | |
| Vanvandang Tu Van | -- | Financial Title Company | |
| Trang Hoa Ngoc | -- | North American Title Co Inc | |
| Trang Hoa Ngoc | $185,000 | North American Title Co Inc |
Source: Public Records
Mortgage History
| Date | Status | Borrower | Loan Amount |
|---|---|---|---|
| Open | Vanvandang Tu Van | $255,000 | |
| Closed | Trang Hoa Ngoc | $148,000 |
Source: Public Records
Tax History Compared to Growth
Tax History
| Year | Tax Paid | Tax Assessment Tax Assessment Total Assessment is a certain percentage of the fair market value that is determined by local assessors to be the total taxable value of land and additions on the property. | Land | Improvement |
|---|---|---|---|---|
| 2025 | $7,505 | $469,865 | $191,922 | $277,943 |
| 2024 | $7,505 | $460,653 | $188,159 | $272,494 |
| 2023 | $7,342 | $451,621 | $184,470 | $267,151 |
| 2022 | $7,304 | $442,766 | $180,853 | $261,913 |
| 2021 | $7,150 | $434,085 | $177,307 | $256,778 |
| 2020 | $6,833 | $429,635 | $175,489 | $254,146 |
| 2019 | $6,653 | $421,212 | $172,049 | $249,163 |
| 2018 | $6,569 | $412,954 | $168,676 | $244,278 |
| 2017 | $6,462 | $404,858 | $165,369 | $239,489 |
| 2016 | $6,162 | $396,921 | $162,127 | $234,794 |
| 2015 | $6,078 | $390,960 | $159,692 | $231,268 |
| 2014 | $5,492 | $383,302 | $156,564 | $226,738 |
Source: Public Records
Map
Nearby Homes
- 3699 Cedar Knoll Ct
- 1520 E Capitol Expy
- 1520 E Capitol Expy Unit 29
- 3463 Sugarcreek Ct
- 1250 Medley Dr
- 3326 Shadow Park Place
- 1188 Alvernaz Dr
- 3241 Shadow Park Place
- 3843 Marfrance Dr
- 3262 Firth Way
- 3016 Shadow Springs Place Unit 113
- 1317 Bilbo Ct
- 1227 Shadowfax Dr
- 3826 Carryduff Way
- 1868 Bagpipe Way
- 3789 Ashridge Ln
- 3910 Edenwood Dr
- 3248 Rocky Water Ln
- 2114 Bennighof Ct
- 839 Leyte Ct
- 1409 Meadow Glen Way
- 0000 Dove Hill Rd
- 1413 Meadow Glen Way
- 3607 Bridal Place Ct
- 1406 Meadow Glen Way
- 1417 Meadow Glen Way
- 1410 Meadow Glen Way
- 3615 Bridal Place Ct
- 3608 Bridal Place Ct
- 1414 Meadow Glen Way
- 1421 Meadow Glen Way
- 3616 Bridal Place Ct
- 1411 Colt Way
- 1418 Meadow Glen Way
- 3623 Bridal Place Ct
- 1425 Meadow Glen Way
- 3605 Rox Place Ct
- 1417 Colt Way
- 3624 Bridal Place Ct
- 3631 Bridal Place Ct