1405 Quinn Ave Memphis, TN 38106
Southeast Memphis NeighborhoodEstimated Value: $86,000 - $123,000
4
Beds
2
Baths
1,541
Sq Ft
$68/Sq Ft
Est. Value
About This Home
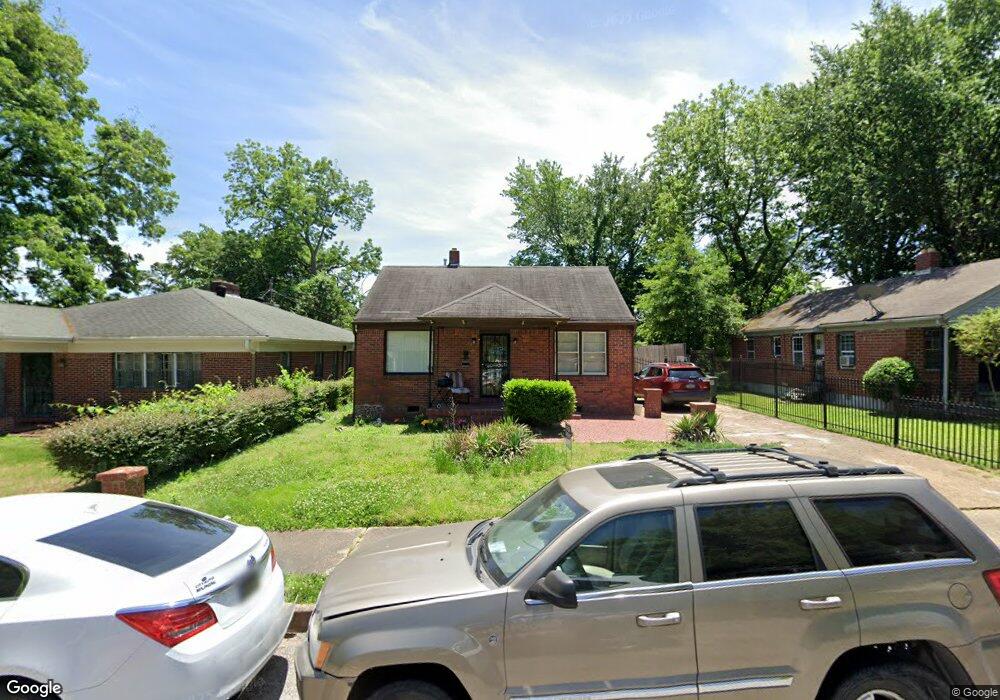
This home is located at 1405 Quinn Ave, Memphis, TN 38106 and is currently estimated at $105,347, approximately $68 per square foot. 1405 Quinn Ave is a home located in Shelby County with nearby schools including Hamilton High School, Memphis Delta Preparatory Charter School, and Soulsville Charter School.
Ownership History
Date
Name
Owned For
Owner Type
Purchase Details
Closed on
Jul 17, 2018
Sold by
County Of Shelby
Bought by
Meyer Tanique
Current Estimated Value
Purchase Details
Closed on
Feb 7, 2018
Sold by
County Of Shelby
Bought by
Noel Dominique
Purchase Details
Closed on
Nov 7, 2017
Sold by
Rodgers Wendyn
Bought by
Rodgers Brianna
Purchase Details
Closed on
Jan 3, 2016
Sold by
Noel Wesley
Bought by
Noel Wendolyn
Purchase Details
Closed on
Mar 14, 2011
Sold by
Noel Maric
Bought by
Noel Wesley
Purchase Details
Closed on
Jan 4, 2011
Sold by
Rodgers Wendolyn
Bought by
Noel Mario
Purchase Details
Closed on
Jan 19, 2010
Sold by
Noel Mario
Bought by
Rodgers Wendolyn
Purchase Details
Closed on
Aug 20, 2009
Sold by
Rodgers Wendelyn
Bought by
Noel Mario
Purchase Details
Closed on
Oct 13, 2005
Sold by
Noel Wesley
Bought by
Rodgers Wendolyn Janae
Purchase Details
Closed on
Jan 4, 2005
Sold by
Bailey Eddie and Bailey Barbara
Bought by
Noel Wesley
Create a Home Valuation Report for This Property
The Home Valuation Report is an in-depth analysis detailing your home's value as well as a comparison with similar homes in the area
Home Values in the Area
Average Home Value in this Area
Purchase History
| Date | Buyer | Sale Price | Title Company |
|---|---|---|---|
| Meyer Tanique | $600 | None Available | |
| Noel Dominique | $1,000 | None Available | |
| Rodgers Brianna | -- | None Available | |
| Noel Wendolyn | -- | None Available | |
| Noel Wesley | -- | None Available | |
| Noel Mario | -- | None Available | |
| Rodgers Wendolyn | -- | None Available | |
| Noel Mario | -- | None Available | |
| Rodgers Wendolyn Janae | -- | -- | |
| Noel Wesley | -- | -- |
Source: Public Records
Tax History Compared to Growth
Tax History
| Year | Tax Paid | Tax Assessment Tax Assessment Total Assessment is a certain percentage of the fair market value that is determined by local assessors to be the total taxable value of land and additions on the property. | Land | Improvement |
|---|---|---|---|---|
| 2025 | $470 | $27,600 | $1,725 | $25,875 |
| 2024 | $470 | $13,875 | $875 | $13,000 |
| 2023 | $845 | $13,875 | $875 | $13,000 |
| 2022 | $845 | $13,875 | $875 | $13,000 |
| 2021 | $855 | $13,875 | $875 | $13,000 |
| 2020 | $987 | $13,625 | $875 | $12,750 |
| 2019 | $987 | $13,625 | $875 | $12,750 |
| 2018 | $987 | $13,625 | $875 | $12,750 |
| 2017 | $560 | $13,625 | $875 | $12,750 |
| 2016 | $589 | $13,475 | $0 | $0 |
| 2014 | $589 | $13,475 | $0 | $0 |
Source: Public Records
Map
Nearby Homes
- 1371 S Parkway E
- 1338 Dunnavant St
- 1358 S Parkway E
- 1437 Silver St
- 1390 Wilson St
- 1337 Wilson St
- 1333 Wilson St
- 1299 Dunnavant St
- 1374 Rayner St
- 1423 S Willett St
- 1427 S Willett St
- 1554 Pillow St
- 0 Dunnavant St Unit 10199375
- 1245 Quinn Ave
- 1345 Gold Ave
- 1410 South Ave
- 1372 South Ave
- 1463 Ragan St
- 1399 South Ave
- 1493 Ragan St