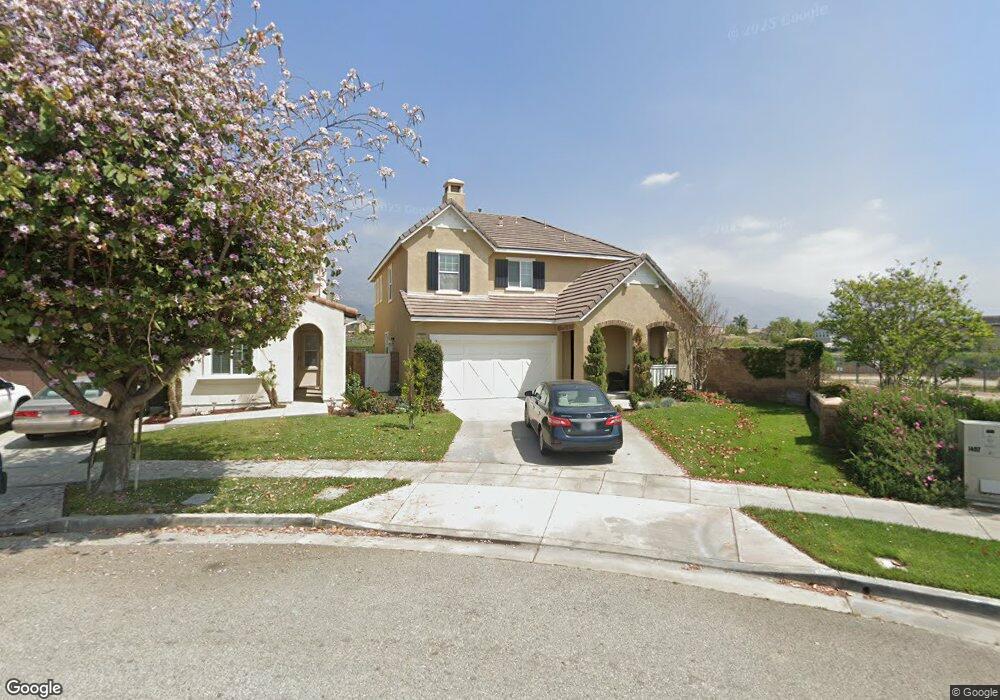
1405 Seth Loop N Upland, CA 91784
Estimated Value: $859,650 - $1,005,000
3
Beds
3
Baths
2,222
Sq Ft
$422/Sq Ft
Est. Value
About This Home
This home is located at 1405 Seth Loop N, Upland, CA 91784 and is currently estimated at $936,913, approximately $421 per square foot. 1405 Seth Loop N is a home located in San Bernardino County with nearby schools including Foothill Knolls STEM Academy of Innovation, Upland High School, and St. Joseph Elementary School.
Ownership History
Date
Name
Owned For
Owner Type
Purchase Details
Closed on
Feb 21, 2013
Sold by
Collister James and Collister Janet Lynn
Bought by
Collister James and Collister Janet Lynn
Current Estimated Value
Home Financials for this Owner
Home Financials are based on the most recent Mortgage that was taken out on this home.
Original Mortgage
$303,000
Outstanding Balance
$59,608
Interest Rate
3.34%
Mortgage Type
New Conventional
Estimated Equity
$877,305
Purchase Details
Closed on
Jun 6, 2011
Sold by
Reeve Jeffrey Charles and Reeve Kelly Michelle
Bought by
Collister James and Davidson Janet Lynn
Home Financials for this Owner
Home Financials are based on the most recent Mortgage that was taken out on this home.
Original Mortgage
$314,000
Interest Rate
4.54%
Mortgage Type
New Conventional
Purchase Details
Closed on
Jul 20, 2005
Sold by
Taylor Woodrow Homes Inc
Bought by
Reeve Jeffrey Charles and Reeve Kelly Michelle
Home Financials for this Owner
Home Financials are based on the most recent Mortgage that was taken out on this home.
Original Mortgage
$446,000
Interest Rate
5.37%
Mortgage Type
Fannie Mae Freddie Mac
Create a Home Valuation Report for This Property
The Home Valuation Report is an in-depth analysis detailing your home's value as well as a comparison with similar homes in the area
Home Values in the Area
Average Home Value in this Area
Purchase History
| Date | Buyer | Sale Price | Title Company |
|---|---|---|---|
| Collister James | -- | Fidelity National Title Co | |
| Collister James | $410,000 | Old Republic Title | |
| Reeve Jeffrey Charles | $558,000 | Fidelity-Riverside |
Source: Public Records
Mortgage History
| Date | Status | Borrower | Loan Amount |
|---|---|---|---|
| Open | Collister James | $303,000 | |
| Closed | Collister James | $314,000 | |
| Previous Owner | Reeve Jeffrey Charles | $446,000 |
Source: Public Records
Tax History
| Year | Tax Paid | Tax Assessment Tax Assessment Total Assessment is a certain percentage of the fair market value that is determined by local assessors to be the total taxable value of land and additions on the property. | Land | Improvement |
|---|---|---|---|---|
| 2025 | $8,400 | $514,983 | $180,244 | $334,739 |
| 2024 | $8,121 | $504,885 | $176,710 | $328,175 |
| 2023 | $7,965 | $494,985 | $173,245 | $321,740 |
| 2022 | $8,291 | $485,279 | $169,848 | $315,431 |
| 2021 | $8,142 | $475,764 | $166,518 | $309,246 |
| 2020 | $7,841 | $470,886 | $164,811 | $306,075 |
| 2019 | $7,814 | $461,653 | $161,579 | $300,074 |
| 2018 | $7,595 | $452,601 | $158,411 | $294,190 |
| 2017 | $7,233 | $443,727 | $155,305 | $288,422 |
| 2016 | $7,015 | $435,027 | $152,260 | $282,767 |
| 2015 | $6,909 | $428,493 | $149,973 | $278,520 |
| 2014 | $6,792 | $420,099 | $147,035 | $273,064 |
Source: Public Records
Map
Nearby Homes
- 1842 Richards Place
- 1855 Old Baldy Way
- 1267 Kendra Ln
- 1409 Upland Hills Dr N Unit N
- 1060 Pebble Beach Dr Unit 58
- 1631 Quail St
- 1015 Pebble Beach Dr
- 1661 Danbrook Place
- 1535 Upland Hills Dr S
- 7212 Rancho Rosa Way
- 1568 N La Quinta Dr
- 1182 Upland Hills Dr S
- 8510 Monte Vista St
- 8682 La Grande St
- 8715 Lurline St
- 6361 Sard St
- 6389 Jasper St
- 1420 Felicita Ct
- 1382 Crawford Ave
- 1942 N 3rd Ave
- 1401 Seth Loop N
- 1397 Seth Loop N
- 1391 Seth Loop N
- 1415 Gabriella Ct
- 1773 Seth Loop E
- 1419 Gabriella Ct
- 1387 Seth Loop N
- 1425 Gabriella Ct
- 1769 Seth Loop E
- 1379 Seth Loop N
- 1767 Seth Loop E
- 1375 Seth Loop N
- 1770 Seth Loop W
- 1763 Seth Loop E
- 1414 Gabriella Ct
- 1768 Seth Loop W Unit 1
- 1768 Seth Loop W
- 1418 Gabriella Ct
- 1367 Seth Loop N
- 1757 Seth Loop W
Your Personal Tour Guide
Ask me questions while you tour the home.