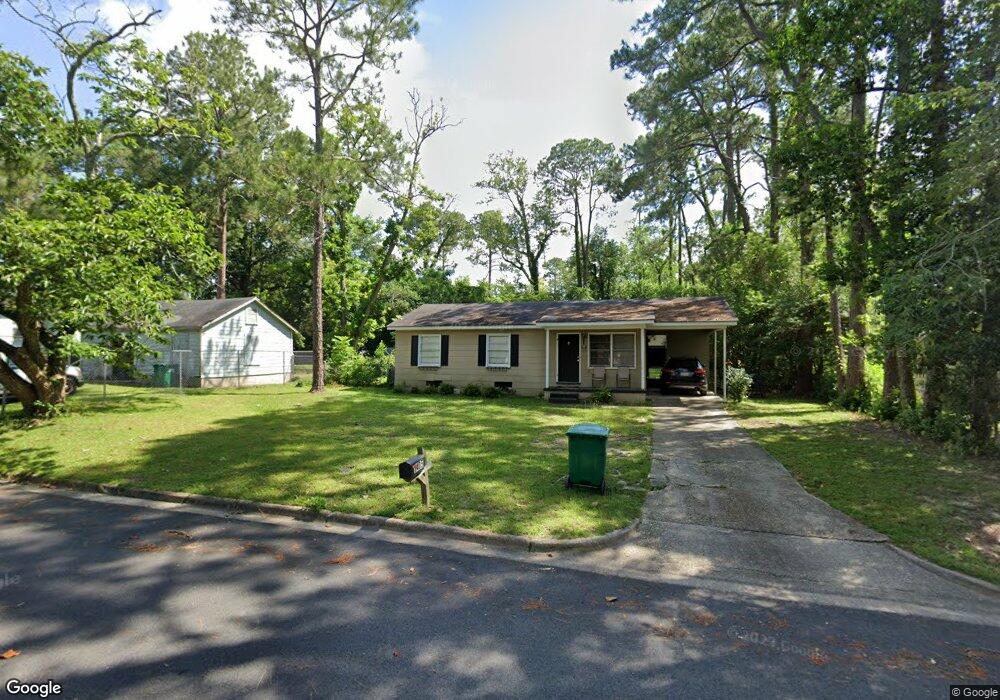
1405 W 2nd Ave Albany, GA 31707
Eudgemar NeighborhoodEstimated Value: $98,000 - $119,000
3
Beds
1
Bath
1,331
Sq Ft
$82/Sq Ft
Est. Value
About This Home
This home is located at 1405 W 2nd Ave, Albany, GA 31707 and is currently estimated at $108,667, approximately $81 per square foot. 1405 W 2nd Ave is a home located in Dougherty County with nearby schools including Sherwood Acres Elementary School, Merry Acres Middle School, and Albany High School.
Ownership History
Date
Name
Owned For
Owner Type
Purchase Details
Closed on
Mar 16, 2023
Sold by
Rental Real Estate Llc
Bought by
Cole Cross Group Llp
Current Estimated Value
Purchase Details
Closed on
Sep 27, 2005
Sold by
Lanier James Ryan
Bought by
Rental Real Estate Llc
Purchase Details
Closed on
Apr 19, 2004
Sold by
Marbury Lovic J
Bought by
Lanier James Ryan
Purchase Details
Closed on
Apr 13, 1999
Sold by
Folsom David B and Folsom Christina L
Bought by
Marbury Lovic J
Purchase Details
Closed on
Feb 4, 1998
Sold by
Woodley Jeffrey Steven
Bought by
Folsom David B and Folsom Christina L
Purchase Details
Closed on
Aug 19, 1997
Sold by
Maxwell Bruce R and Maxwell Sheryl A
Bought by
Woodley Jeffrey Steven
Purchase Details
Closed on
Oct 20, 1987
Sold by
Shamlee Shamlee C and Shamlee W
Bought by
Bruce Bruce R and Bruce T
Create a Home Valuation Report for This Property
The Home Valuation Report is an in-depth analysis detailing your home's value as well as a comparison with similar homes in the area
Home Values in the Area
Average Home Value in this Area
Purchase History
| Date | Buyer | Sale Price | Title Company |
|---|---|---|---|
| Cole Cross Group Llp | $132,500 | -- | |
| Rental Real Estate Llc | $70,000 | -- | |
| Lanier James Ryan | $62,000 | -- | |
| Marbury Lovic J | $55,000 | -- | |
| Folsom David B | $54,900 | -- | |
| Woodley Jeffrey Steven | $54,000 | -- | |
| Bruce Bruce R | $34,000 | -- |
Source: Public Records
Mortgage History
| Date | Status | Borrower | Loan Amount |
|---|---|---|---|
| Closed | Rental Real Estate Llc | $0 |
Source: Public Records
Tax History Compared to Growth
Tax History
| Year | Tax Paid | Tax Assessment Tax Assessment Total Assessment is a certain percentage of the fair market value that is determined by local assessors to be the total taxable value of land and additions on the property. | Land | Improvement |
|---|---|---|---|---|
| 2024 | $1,044 | $23,560 | $5,360 | $18,200 |
| 2023 | $1,098 | $23,560 | $5,360 | $18,200 |
| 2022 | $1,102 | $23,560 | $5,360 | $18,200 |
| 2021 | $1,021 | $23,560 | $5,360 | $18,200 |
| 2020 | $1,024 | $23,560 | $5,360 | $18,200 |
| 2019 | $1,028 | $23,560 | $5,360 | $18,200 |
| 2018 | $0 | $23,560 | $5,360 | $18,200 |
| 2017 | $961 | $23,560 | $5,360 | $18,200 |
| 2016 | $962 | $23,560 | $5,360 | $18,200 |
| 2015 | $965 | $23,560 | $5,360 | $18,200 |
| 2014 | $953 | $23,560 | $5,360 | $18,200 |
Source: Public Records
Map
Nearby Homes
- 1306 W 3rd Ave
- 1512 W 2nd Ave
- 1213 W 2nd Ave
- 1307 W 4th Ave
- 1215 Maryland Dr
- 1307 5th Ave
- 1505 5th Ave
- 523 Eugemar Dr
- 1108 W 4th Ave
- 1603 Maryland Dr
- 405 Lucille St
- 511 Baldwin Dr
- 1123 Eager Dr
- 1506 7th Ave
- 1013 Rosedale Ave
- 1009 W 3rd Ave
- 615 Haley St
- 1403 Edgewood Ln
- 600 N Ingleside Dr
- 520 Baldwin Dr