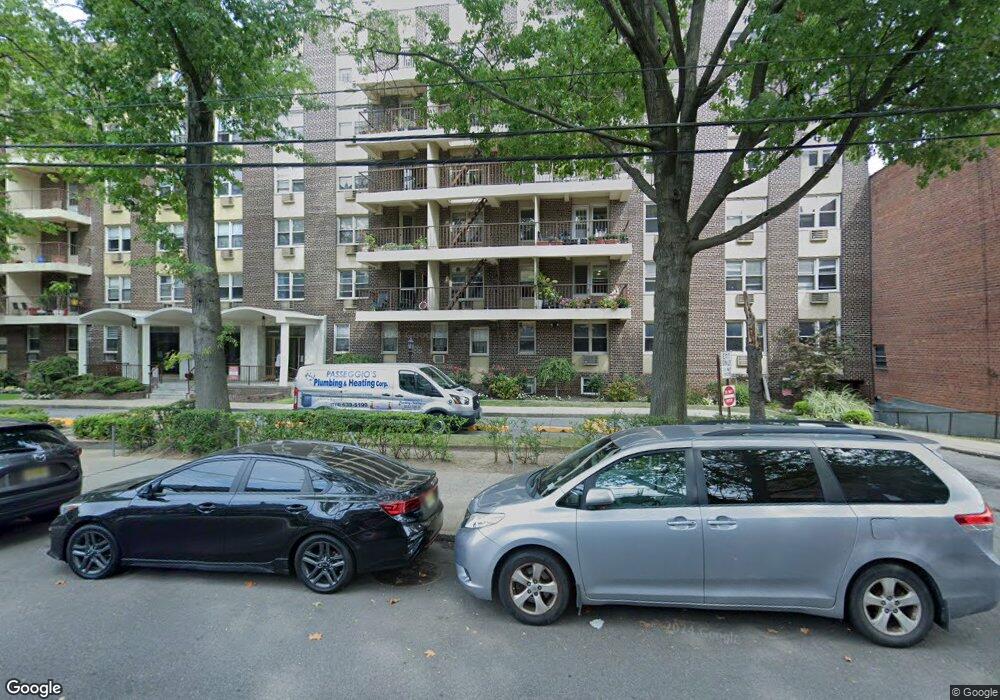
14059 34th Ave Unit 3L Flushing, NY 11354
Flushing NeighborhoodEstimated Value: $769,000 - $867,000
--
Bed
--
Bath
1,285
Sq Ft
$625/Sq Ft
Est. Value
About This Home
This home is located at 14059 34th Ave Unit 3L, Flushing, NY 11354 and is currently estimated at $802,841, approximately $624 per square foot. 14059 34th Ave Unit 3L is a home located in Queens County with nearby schools including P.S. 21 Edward Hart, Flushing High School, and Windsor School.
Ownership History
Date
Name
Owned For
Owner Type
Purchase Details
Closed on
May 10, 2021
Sold by
Kim Yun Jung and Kim Yun-Jung
Bought by
Patricia J Kim Trustee and Yun-Jung Kim Irrevocable Trust
Current Estimated Value
Purchase Details
Closed on
Apr 11, 2013
Sold by
Kim Hyang Kyum
Bought by
Kim Yun-Jung
Purchase Details
Closed on
Oct 15, 2010
Sold by
Richard A Daniel Co-Trustee and William Forman Trust
Bought by
Kim Hyang Kyum
Home Financials for this Owner
Home Financials are based on the most recent Mortgage that was taken out on this home.
Original Mortgage
$200,000
Interest Rate
4.37%
Mortgage Type
Purchase Money Mortgage
Purchase Details
Closed on
May 19, 2004
Sold by
Forman William
Bought by
Daniel Richard A and Daniel William J
Create a Home Valuation Report for This Property
The Home Valuation Report is an in-depth analysis detailing your home's value as well as a comparison with similar homes in the area
Home Values in the Area
Average Home Value in this Area
Purchase History
| Date | Buyer | Sale Price | Title Company |
|---|---|---|---|
| Patricia J Kim Trustee | -- | -- | |
| Patricia J Kim Trustee | -- | -- | |
| Patricia J Kim Trustee | -- | -- | |
| Kim Yun-Jung | $530,000 | -- | |
| Kim Yun-Jung | $530,000 | -- | |
| Kim Hyang Kyum | $440,000 | -- | |
| Kim Hyang Kyum | $440,000 | -- | |
| Daniel Richard A | -- | -- | |
| Daniel Richard A | -- | -- |
Source: Public Records
Mortgage History
| Date | Status | Borrower | Loan Amount |
|---|---|---|---|
| Previous Owner | Kim Hyang Kyum | $200,000 |
Source: Public Records
Tax History Compared to Growth
Tax History
| Year | Tax Paid | Tax Assessment Tax Assessment Total Assessment is a certain percentage of the fair market value that is determined by local assessors to be the total taxable value of land and additions on the property. | Land | Improvement |
|---|---|---|---|---|
| 2025 | $3,360 | $55,142 | $15,655 | $39,487 |
| 2024 | $3,360 | $53,757 | $14,181 | $39,576 |
| 2023 | $3,307 | $52,902 | $12,707 | $40,195 |
| 2022 | $4,796 | $54,934 | $15,655 | $39,279 |
| 2021 | $5,729 | $46,705 | $15,655 | $31,050 |
| 2020 | $6,118 | $52,713 | $8,287 | $44,426 |
| 2019 | $5,795 | $53,169 | $8,287 | $44,882 |
| 2018 | $5,379 | $42,294 | $8,287 | $34,007 |
| 2017 | $4,935 | $38,800 | $8,287 | $30,513 |
| 2016 | $4,785 | $38,800 | $8,287 | $30,513 |
| 2015 | $2,694 | $35,447 | $8,287 | $27,160 |
| 2014 | $2,694 | $34,370 | $8,287 | $26,083 |
Source: Public Records
Map
Nearby Homes
- 138-35 39th Ave Unit 10F
- 138-35 39th Ave Unit 17H
- 138-35 39th Ave Unit 4K
- 138-35 39th Ave Unit 12L
- 138-35 39th Ave Unit 11L
- 138-35 39th Ave Unit 8G
- 3205 Linden Place #P7
- 138-35 39th Ave Unit 16K
- 118-09 29th Ave
- 140-39 34th Ave Unit 2T
- 140-33 34th Ave Unit 2B
- 140-33 34th Ave Unit 5C
- 139-35 35th Ave Unit 6F
- 140-40 34th Ave Unit 2A
- 139-30 34th Ave Unit 3B
- 139-30 34th Ave Unit 4C
- 13930 34th Ave Unit 2A
- 139-39 35th Ave Unit 5C
- 14018 33rd Ave Unit 104
- 140-55 34th Ave Unit 3B
- 14015 34th Ave
- 14013 34th Ave
- 14017 34th Ave
- 14009 34th Ave
- 14019 34th Ave Unit 2Fl. 3080092
- 140-19 34th Ave Unit 2Fl.
- 14019 34th Ave
- 14021 34th Ave
- 14007 34th Ave
- 3341 Union St
- 3337 Union St
- 3339 Union St
- 3335 Union St
- 33-43 Union St
- 3335 Union St
- 33-39 Union St Unit 4F
- 33-39 Union St Unit 3F
- 3345 Union St
- 138-35 39th Ave Unit 14D
- 136-23 41