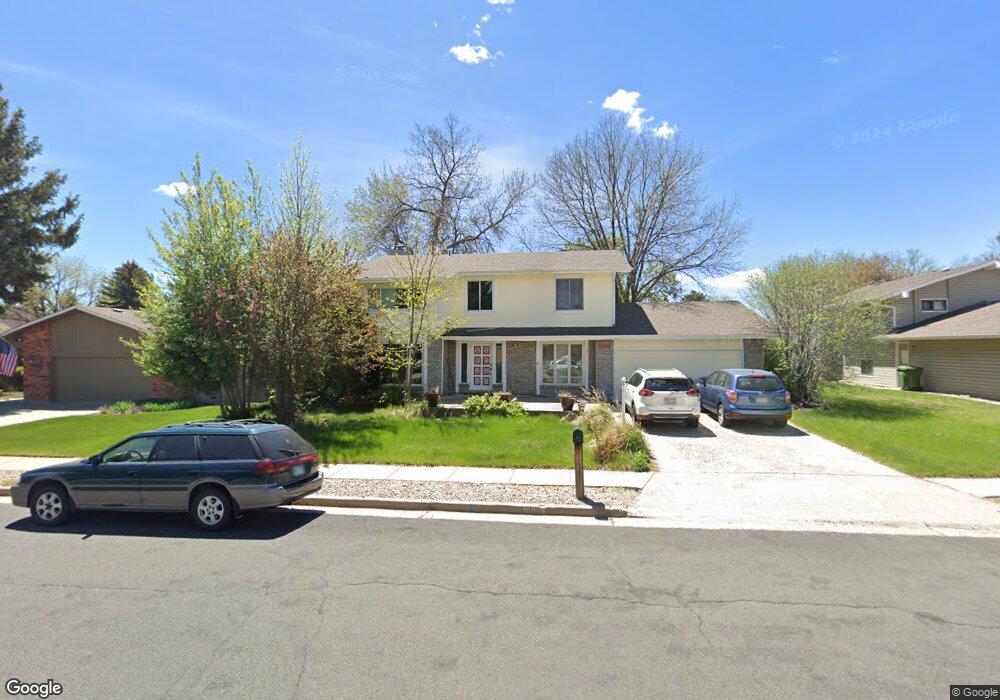
1406 Allison Dr Loveland, CO 80538
Estimated Value: $497,060 - $580,000
4
Beds
4
Baths
2,088
Sq Ft
$262/Sq Ft
Est. Value
About This Home
This home is located at 1406 Allison Dr, Loveland, CO 80538 and is currently estimated at $546,015, approximately $261 per square foot. 1406 Allison Dr is a home located in Larimer County with nearby schools including Centennial Elementary School, Lucile Erwin Middle School, and Loveland High School.
Ownership History
Date
Name
Owned For
Owner Type
Purchase Details
Closed on
Feb 22, 2010
Sold by
Hallmark Timothy Blake and Hallmark Linnea K
Bought by
Hallmark Timothy Blake
Current Estimated Value
Home Financials for this Owner
Home Financials are based on the most recent Mortgage that was taken out on this home.
Original Mortgage
$187,500
Outstanding Balance
$124,217
Interest Rate
5.05%
Mortgage Type
New Conventional
Estimated Equity
$421,798
Purchase Details
Closed on
Feb 28, 2001
Sold by
Shelton Virginia Gore
Bought by
Hallmark Timothy Blake and Hallmark Linnea K
Home Financials for this Owner
Home Financials are based on the most recent Mortgage that was taken out on this home.
Original Mortgage
$173,600
Interest Rate
6.97%
Purchase Details
Closed on
Apr 1, 1995
Sold by
Mcswain W Randolph
Bought by
Shelton Virginia Gore
Purchase Details
Closed on
Jun 1, 1993
Sold by
Salditt Christine L
Bought by
Mcswain W Randolph
Create a Home Valuation Report for This Property
The Home Valuation Report is an in-depth analysis detailing your home's value as well as a comparison with similar homes in the area
Home Values in the Area
Average Home Value in this Area
Purchase History
| Date | Buyer | Sale Price | Title Company |
|---|---|---|---|
| Hallmark Timothy Blake | -- | Chicago Title Co | |
| Hallmark Timothy Blake | $217,000 | Land Title Guarantee Company | |
| Shelton Virginia Gore | $158,300 | -- | |
| Mcswain W Randolph | $143,900 | -- |
Source: Public Records
Mortgage History
| Date | Status | Borrower | Loan Amount |
|---|---|---|---|
| Open | Hallmark Timothy Blake | $187,500 | |
| Closed | Hallmark Timothy Blake | $173,600 |
Source: Public Records
Tax History Compared to Growth
Tax History
| Year | Tax Paid | Tax Assessment Tax Assessment Total Assessment is a certain percentage of the fair market value that is determined by local assessors to be the total taxable value of land and additions on the property. | Land | Improvement |
|---|---|---|---|---|
| 2025 | $2,829 | $39,135 | $4,355 | $34,780 |
| 2024 | $2,729 | $39,135 | $4,355 | $34,780 |
| 2022 | $2,340 | $29,413 | $4,518 | $24,895 |
| 2021 | $2,405 | $30,259 | $4,648 | $25,611 |
| 2020 | $2,288 | $28,779 | $4,648 | $24,131 |
| 2019 | $2,250 | $28,779 | $4,648 | $24,131 |
| 2018 | $2,102 | $25,546 | $4,680 | $20,866 |
| 2017 | $1,810 | $25,546 | $4,680 | $20,866 |
| 2016 | $1,673 | $22,805 | $5,174 | $17,631 |
| 2015 | $1,659 | $23,330 | $5,170 | $18,160 |
| 2014 | $1,477 | $19,640 | $5,170 | $14,470 |
Source: Public Records
Map
Nearby Homes
- 2922 Alamosa Ct
- 1463 Caddoa Dr
- 1534 W 28th St
- 3621 Adena Ct
- 2468 Chama Ct
- 2894 Empire Ave
- 1428 W 25th St
- 2306 Cameo Ave
- 3679 Wild Horse Ct Unit 3679
- 957 Logan Ct
- 3210 N Colorado Ave
- 706 W 29th St
- 3312 N Colorado Ave
- 1805 W 22nd St
- 717 W 36th St
- 2503 N Estrella Ave
- 3110 N Franklin Ave
- 2628 Hayden Ct
- 2938 Glendevey Dr
- 2001 Cameo Ave
- 1410 Allison Dr
- 1407 W 31st St
- 1409 W 31st St
- 1405 W 31st St
- 1414 Allison Dr
- 1402 Allison Dr
- 1415 Allison Dr
- 1411 Allison Dr
- 1417 W 31st St
- 1419 Allison Dr
- 1403 W 31st St
- 1418 Allison Dr
- 1407 Allison Dr
- 1400 Allison Dr
- 1423 Allison Dr
- 1421 W 31st St
- 1401 W 31st St
- 1414 W 31st St
- 1416 Antero Dr
- 1420 Antero Dr