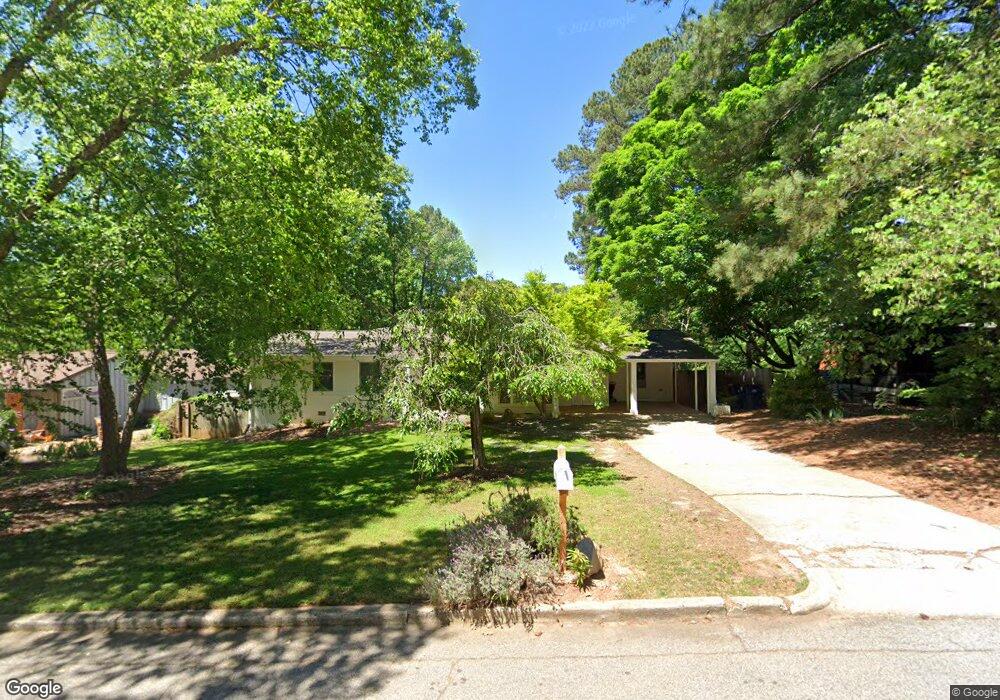
1406 Ashburton Rd Raleigh, NC 27606
Avent West NeighborhoodEstimated Value: $457,000 - $598,000
3
Beds
2
Baths
1,408
Sq Ft
$380/Sq Ft
Est. Value
About This Home
This home is located at 1406 Ashburton Rd, Raleigh, NC 27606 and is currently estimated at $534,700, approximately $379 per square foot. 1406 Ashburton Rd is a home located in Wake County with nearby schools including A. B. Combs Magnet Elementary School, Centennial Campus Magnet Middle School, and Atlas International School.
Ownership History
Date
Name
Owned For
Owner Type
Purchase Details
Closed on
Feb 24, 2017
Sold by
Bruns Pamela J and Browne Chrys C
Bought by
Ratterree Katherine and Johnson Hays Davenport
Current Estimated Value
Home Financials for this Owner
Home Financials are based on the most recent Mortgage that was taken out on this home.
Original Mortgage
$263,200
Outstanding Balance
$217,956
Interest Rate
4.12%
Mortgage Type
New Conventional
Estimated Equity
$316,744
Purchase Details
Closed on
Jan 27, 2006
Sold by
Holloman David R and Holloman Keiko M
Bought by
John Wieland Homes & Neighborhoods Of Th
Purchase Details
Closed on
Mar 30, 1998
Sold by
Wickers James E and Wickes Karen D
Bought by
Bruns Pamela J and Browne Chrys C
Home Financials for this Owner
Home Financials are based on the most recent Mortgage that was taken out on this home.
Original Mortgage
$113,900
Interest Rate
7.01%
Create a Home Valuation Report for This Property
The Home Valuation Report is an in-depth analysis detailing your home's value as well as a comparison with similar homes in the area
Home Values in the Area
Average Home Value in this Area
Purchase History
| Date | Buyer | Sale Price | Title Company |
|---|---|---|---|
| Ratterree Katherine | $329,000 | None Available | |
| John Wieland Homes & Neighborhoods Of Th | $1,309,500 | None Available | |
| Bruns Pamela J | $120,000 | -- |
Source: Public Records
Mortgage History
| Date | Status | Borrower | Loan Amount |
|---|---|---|---|
| Open | Ratterree Katherine | $263,200 | |
| Previous Owner | Bruns Pamela J | $113,900 |
Source: Public Records
Tax History Compared to Growth
Tax History
| Year | Tax Paid | Tax Assessment Tax Assessment Total Assessment is a certain percentage of the fair market value that is determined by local assessors to be the total taxable value of land and additions on the property. | Land | Improvement |
|---|---|---|---|---|
| 2025 | $4,540 | $518,232 | $200,000 | $318,232 |
| 2024 | $4,171 | $518,232 | $200,000 | $318,232 |
| 2023 | $3,656 | $333,535 | $105,000 | $228,535 |
| 2022 | $3,397 | $333,535 | $105,000 | $228,535 |
| 2021 | $3,265 | $333,535 | $105,000 | $228,535 |
| 2020 | $3,206 | $333,535 | $105,000 | $228,535 |
| 2019 | $2,844 | $243,696 | $90,000 | $153,696 |
| 2018 | $2,683 | $243,696 | $90,000 | $153,696 |
| 2017 | $2,555 | $243,696 | $90,000 | $153,696 |
| 2016 | $2,503 | $243,696 | $90,000 | $153,696 |
| 2015 | $2,530 | $242,442 | $90,000 | $152,442 |
| 2014 | -- | $242,442 | $90,000 | $152,442 |
Source: Public Records
Map
Nearby Homes
- 5101 Wickham Rd
- 4609 Kaplan Dr
- 713 Valerie Dr
- 913 Merwin Rd
- 3916 Wendy Ln Unit 8B2
- 3952 Wendy Ln
- 1400 Crete Dr
- 3710 Lail Ct
- 1421 Athens Dr
- 5401 Kaplan Dr
- 1312 Onslow Rd
- 1277 Teakwood Place
- 1704 Athens Dr
- 1208 Schaub Dr Unit B
- 1010 Sandlin Place Unit C
- 1010 Sandlin Place Unit D
- 1295 Schaub Dr Unit F
- 1212 Schaub Dr Unit C
- 1008 Sandlin Place Unit J
- 820 Nuttree Place
- 1410 Ashburton Rd
- 5001 Newcastle Rd
- 5009 Newcastle Rd
- 1414 Ashburton Rd
- 1409 Ashburton Rd
- 1405 Ashburton Rd
- 1413 Ashburton Rd
- 1401 Ashburton Rd
- 5015 Newcastle Rd
- 1308 Ashburton Rd
- 5006 Dunbar Rd
- 1418 Ashburton Rd
- 5012 Newcastle Rd
- 1417 Ashburton Rd
- 1313 Ashburton Rd
- 5016 Newcastle Rd
- 5010 Dunbar Rd
- 1804 Lorimer Rd
- 1304 Ashburton Rd
- 1808 Lorimer Rd