
Landlord's Agent in 2020
Kristie Bryant
Keller Williams Realty
(512) 994-9206
1 in this area
141 Total Sales
Estimated Value: $634,000 - $1,029,000
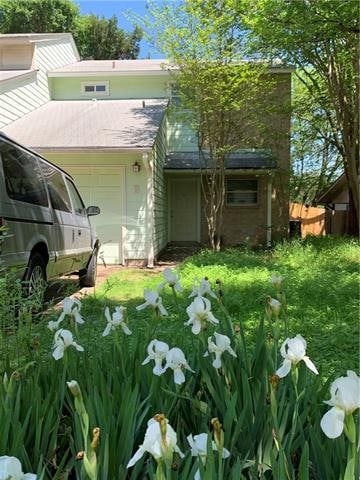
Ask for video. LOCATION South Lamar! Airy, light-filled duplex in the heart of 78704 - like a treehouse. Fenced in yard with shade trees. Walk-in closets and vaulted ceilings. Outdoor porch off master. Fireplace and wall of windows in living and dining area. Hardwoods throughout - tile in upstairs bathroom. Central air and heat. W/D hookups in roomy garage. Nearby park, bus stop, SOCO restaurants, grocery stores, Zilker Park and Town Lake trail. 2 pets with fee/deposit/interview. No aggressive breeds.
Last Agent to Rent the Property
Keller Williams Realty License #0672199 Listed on: 03/24/2020
| Date | Buyer | Sale Price | Title Company |
|---|---|---|---|
| Jolly John R | -- | None Available | |
| Jolly John R | -- | -- |
| Date | Status | Borrower | Loan Amount |
|---|---|---|---|
| Open | Jolly John R | $156,000 | |
| Closed | Jolly John R | $104,499 |
| Date | Event | Price | List to Sale | Price per Sq Ft |
|---|---|---|---|---|
| 04/01/2020 04/01/20 | Rented | $1,650 | 0.0% | -- |
| 03/24/2020 03/24/20 | For Rent | $1,650 | -- | -- |
| Year | Tax Paid | Tax Assessment Tax Assessment Total Assessment is a certain percentage of the fair market value that is determined by local assessors to be the total taxable value of land and additions on the property. | Land | Improvement |
|---|---|---|---|---|
| 2025 | $11,606 | $567,097 | $385,409 | $181,688 |
| 2023 | $16,317 | $901,879 | $500,000 | $401,879 |
| 2022 | $15,424 | $780,996 | $500,000 | $280,996 |
| 2021 | $12,885 | $591,937 | $300,000 | $291,937 |
| 2020 | $10,833 | $505,073 | $300,000 | $205,073 |
| 2018 | $10,915 | $493,015 | $300,000 | $193,015 |
| 2017 | $10,202 | $457,480 | $275,000 | $182,480 |
| 2016 | $8,535 | $382,707 | $230,000 | $152,707 |
| 2015 | $7,159 | $370,552 | $160,000 | $210,552 |
| 2014 | $7,159 | $300,817 | $190,000 | $110,817 |
Landlord's Agent in 2020
Kristie Bryant
Keller Williams Realty
(512) 994-9206
1 in this area
141 Total Sales
Source: Unlock MLS (Austin Board of REALTORS®)
MLS Number: 1174968
APN: 305240
Disclaimer: Certain information contained herein is derived from information provided by parties other than Homes.com. All information provided is deemed reliable, but is not guaranteed to be accurate and should be independently verified.
![]() Based on information from the Austin Board of REALTORS® (alternatively, from ACTRIS). Neither the Board nor ACTRIS guarantees or is in any way responsible for its accuracy. All data is provided “AS IS” and with all faults. Data maintained by the Board or ACTRIS may not reflect all real estate activity in the market.
Based on information from the Austin Board of REALTORS® (alternatively, from ACTRIS). Neither the Board nor ACTRIS guarantees or is in any way responsible for its accuracy. All data is provided “AS IS” and with all faults. Data maintained by the Board or ACTRIS may not reflect all real estate activity in the market.
Information being provided is for consumers’ personal, non-commercial use and may not be used for any purpose other than to identify prospective properties consumers may be interested in purchasing. All data is obtained from various sources and may not have been verified by broker or MLS GRID. Supplied Open House Information is subject to change without notice. All information should be independently reviewed and verified for accuracy. Properties may or may not be listed by the office/agent presenting the information. Some IDX listings have been excluded from this website.
Based on information submitted to the MLS GRID
Ask me questions while you tour the home.