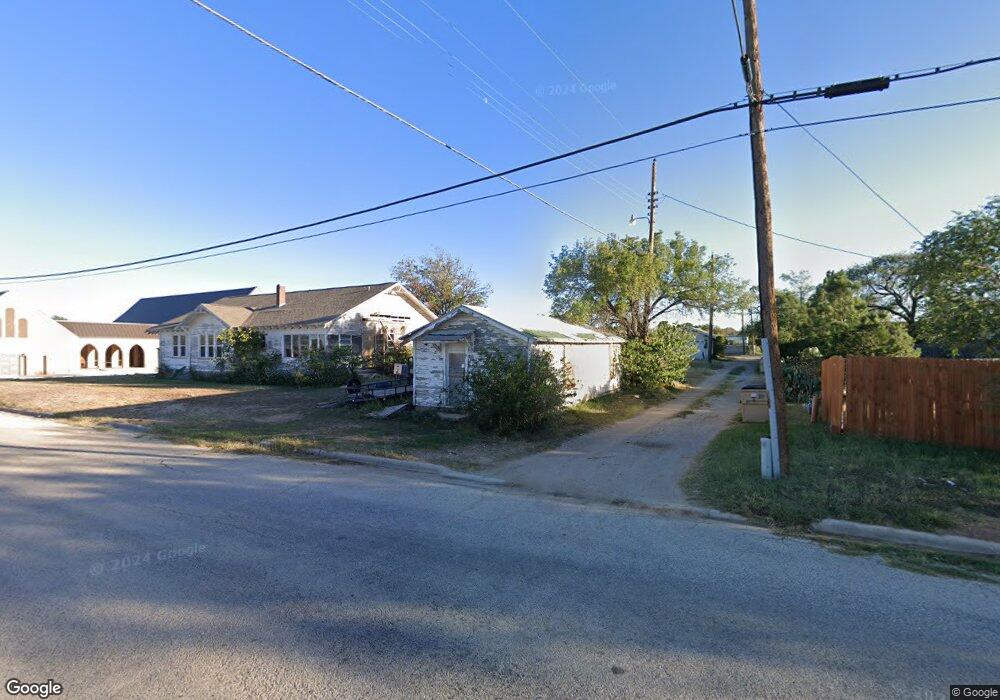
1406 S Main St Big Spring, TX 79720
Estimated Value: $102,000 - $141,000
--
Bed
--
Bath
1,984
Sq Ft
$61/Sq Ft
Est. Value
About This Home
This home is located at 1406 S Main St, Big Spring, TX 79720 and is currently estimated at $120,226, approximately $60 per square foot. 1406 S Main St is a home located in Howard County with nearby schools including Big Spring High School, St. Mary's Episcopal School, and Nazarene Christian Academy Big Spring.
Ownership History
Date
Name
Owned For
Owner Type
Purchase Details
Closed on
Feb 1, 2019
Sold by
Baker Jerry and Baker Carlon
Bought by
Alexader Luz Marie
Current Estimated Value
Home Financials for this Owner
Home Financials are based on the most recent Mortgage that was taken out on this home.
Original Mortgage
$48,000
Outstanding Balance
$30,908
Interest Rate
4.6%
Mortgage Type
Purchase Money Mortgage
Estimated Equity
$89,318
Purchase Details
Closed on
Jun 6, 2012
Sold by
Obrien Paul
Bought by
Baker Jerry Dan and Baker Jerry Dustin
Purchase Details
Closed on
Jul 15, 2009
Sold by
Brien Paul A O and Brien Paul Allen O
Bought by
Brien Paul A O and Brien Kathleen J O
Purchase Details
Closed on
May 14, 1982
Sold by
Penton Lillian S and O'Brien Lillian S
Bought by
O'Brien Paul Allen
Create a Home Valuation Report for This Property
The Home Valuation Report is an in-depth analysis detailing your home's value as well as a comparison with similar homes in the area
Home Values in the Area
Average Home Value in this Area
Purchase History
| Date | Buyer | Sale Price | Title Company |
|---|---|---|---|
| Alexader Luz Marie | -- | None Available | |
| Baker Jerry Dan | -- | None Available | |
| Brien Paul A O | -- | None Available | |
| O'Brien Paul Allen | -- | None Available |
Source: Public Records
Mortgage History
| Date | Status | Borrower | Loan Amount |
|---|---|---|---|
| Open | Alexader Luz Marie | $48,000 |
Source: Public Records
Tax History Compared to Growth
Tax History
| Year | Tax Paid | Tax Assessment Tax Assessment Total Assessment is a certain percentage of the fair market value that is determined by local assessors to be the total taxable value of land and additions on the property. | Land | Improvement |
|---|---|---|---|---|
| 2024 | $1,366 | $97,509 | $5,260 | $92,249 |
| 2023 | $1,230 | $92,933 | $3,500 | $89,433 |
| 2022 | $1,295 | $85,818 | $3,500 | $82,318 |
| 2021 | $1,355 | $94,402 | $3,500 | $90,902 |
| 2020 | $1,247 | $52,427 | $3,500 | $48,927 |
| 2019 | $1,198 | $47,353 | $3,500 | $43,853 |
| 2018 | $1,447 | $48,284 | $3,500 | $44,784 |
| 2017 | $1,507 | $51,186 | $3,500 | $47,686 |
| 2016 | $1,537 | $52,224 | $3,500 | $48,724 |
| 2015 | -- | $51,353 | $3,500 | $47,853 |
| 2014 | -- | $41,264 | $1,500 | $39,764 |
Source: Public Records
Map
Nearby Homes
- 1513 Scurry St
- 1308 Scurry St Unit A,B,C,D,E
- 1606 Johnson St
- 1801 Johnson St
- 1405 Nolan St
- 1903 S Main St
- 107 W 10th St
- 501 E 15th St
- 1305 Pennsylvania Ave
- 1906 Johnson St
- 405 Edwards Blvd
- 1204 Pennsylvania Ave
- 1206 Austin St
- 702 W 18th St
- 801 W 15th St
- 2101 Runnels St
- 803 W 14th St
- 606 E 12th St
- 605 E 12th St
- 0 Interstate 20