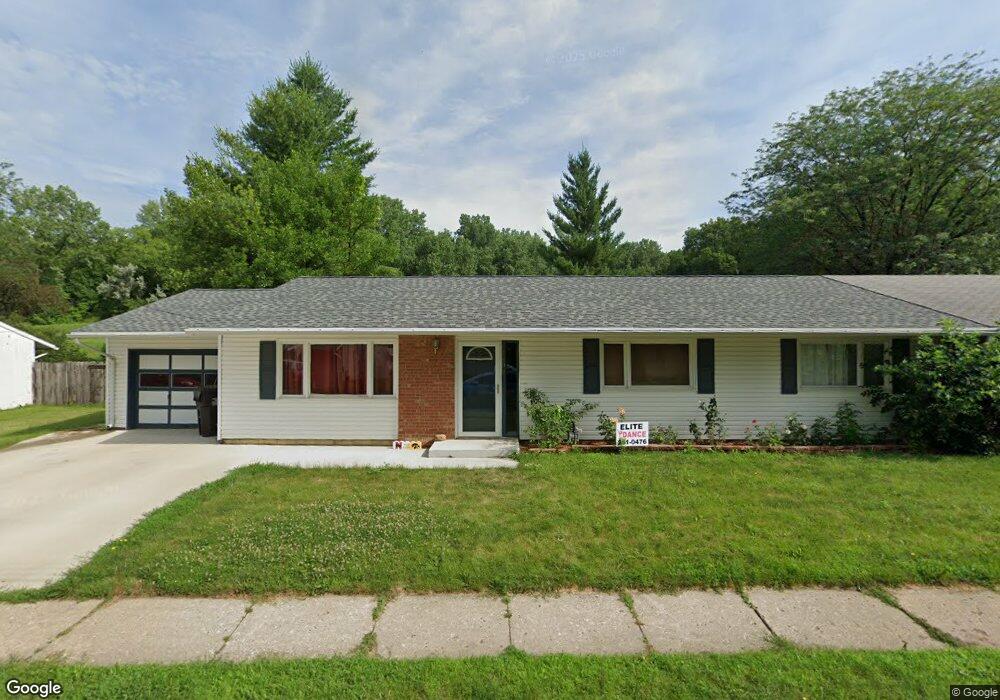
1406 Vandenburg Cir Sergeant Bluff, IA 51054
Estimated Value: $119,000 - $187,895
4
Beds
2
Baths
1,456
Sq Ft
$103/Sq Ft
Est. Value
About This Home
This home is located at 1406 Vandenburg Cir, Sergeant Bluff, IA 51054 and is currently estimated at $149,724, approximately $102 per square foot. 1406 Vandenburg Cir is a home located in Woodbury County with nearby schools including Sergeant Bluff-Luton Primary School, Sergeant Bluff-Luton Elementary School, and Sergeant Bluff-Luton Middle School.
Ownership History
Date
Name
Owned For
Owner Type
Purchase Details
Closed on
Jun 6, 2017
Sold by
Harris Kirk G and Harris Kelli A
Bought by
Chang Calvin S and Yeh Kuen C
Current Estimated Value
Home Financials for this Owner
Home Financials are based on the most recent Mortgage that was taken out on this home.
Original Mortgage
$76,000
Outstanding Balance
$62,990
Interest Rate
3.89%
Mortgage Type
New Conventional
Estimated Equity
$86,734
Purchase Details
Closed on
Jul 7, 2010
Sold by
Harris Kirk G and Harris Keli A
Bought by
Harris Kirk G and Harris Kelli A
Home Financials for this Owner
Home Financials are based on the most recent Mortgage that was taken out on this home.
Original Mortgage
$69,530
Interest Rate
4.77%
Mortgage Type
FHA
Purchase Details
Closed on
Sep 29, 2009
Sold by
Mcdonald Amy
Bought by
Lindgren Jill
Create a Home Valuation Report for This Property
The Home Valuation Report is an in-depth analysis detailing your home's value as well as a comparison with similar homes in the area
Home Values in the Area
Average Home Value in this Area
Purchase History
| Date | Buyer | Sale Price | Title Company |
|---|---|---|---|
| Chang Calvin S | $95,000 | None Available | |
| Harris Kirk G | -- | -- | |
| Lindgren Jill | -- | -- |
Source: Public Records
Mortgage History
| Date | Status | Borrower | Loan Amount |
|---|---|---|---|
| Open | Chang Calvin S | $76,000 | |
| Previous Owner | Harris Kirk G | $69,530 |
Source: Public Records
Tax History
| Year | Tax Paid | Tax Assessment Tax Assessment Total Assessment is a certain percentage of the fair market value that is determined by local assessors to be the total taxable value of land and additions on the property. | Land | Improvement |
|---|---|---|---|---|
| 2025 | $2,070 | $146,280 | $11,280 | $135,000 |
| 2024 | $2,006 | $134,170 | $8,950 | $125,220 |
| 2023 | $1,890 | $134,170 | $8,950 | $125,220 |
| 2022 | $1,874 | $107,560 | $8,950 | $98,610 |
| 2021 | $1,874 | $107,560 | $8,950 | $98,610 |
| 2020 | $1,660 | $93,490 | $9,580 | $83,910 |
| 2019 | $1,378 | $93,490 | $9,580 | $83,910 |
| 2018 | $1,346 | $76,540 | $9,580 | $66,960 |
| 2017 | $1,458 | $76,540 | $9,580 | $66,960 |
| 2016 | $1,486 | $76,540 | $0 | $0 |
| 2015 | $1,131 | $71,530 | $8,950 | $62,580 |
| 2014 | $1,067 | $56,630 | $8,950 | $47,680 |
Source: Public Records
Map
Nearby Homes
- 1404 Vandenburg Cir
- 1408 Vandenburg Cir
- 1410 Vandenburg Cir
- 1409 Vandenberg Cir W
- 1405 Vandenburg Cir
- 1400 Vandenburg Cir
- 1409 Vandenburg Cir
- 1395 Vandenburg Cir
- 1397 Vandenberg Cir E
- 1572 Harrington Loop
- 1412 Vandenburg Cir
- 1394 Vandenberg Cir E
- 1394 Vandenburg Cir
- 1570 Harrington Loop
- 1562 Harrington Loop
- 1419 Vandenburg Cir
- 1560 Harrington Loop
- 1393 Vandenberg Cir
- 1574 Harrington Loop
- 1392 Vandenburg Cir
Your Personal Tour Guide
Ask me questions while you tour the home.