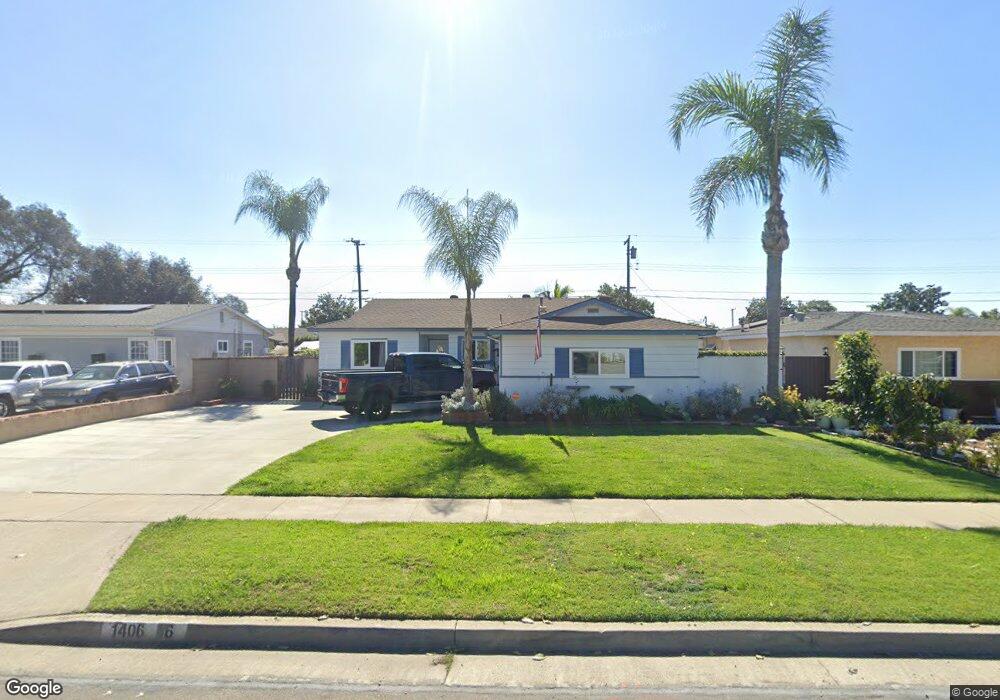
1406 W Baker Ave Fullerton, CA 92833
Estimated Value: $859,000 - $942,000
3
Beds
2
Baths
1,408
Sq Ft
$648/Sq Ft
Est. Value
About This Home
This home is located at 1406 W Baker Ave, Fullerton, CA 92833 and is currently estimated at $912,630, approximately $648 per square foot. 1406 W Baker Ave is a home located in Orange County with nearby schools including Orangethorpe Elementary School, Nicolas Junior High School, and Sunny Hills High School.
Ownership History
Date
Name
Owned For
Owner Type
Purchase Details
Closed on
Aug 17, 2001
Sold by
Fagan Michael E and Fagan Sharon L
Bought by
Jensen Jason Elleby
Current Estimated Value
Home Financials for this Owner
Home Financials are based on the most recent Mortgage that was taken out on this home.
Original Mortgage
$242,077
Interest Rate
6.84%
Mortgage Type
FHA
Purchase Details
Closed on
May 1, 2000
Sold by
Fagan Michael E and Fagan Sharon L
Bought by
Fagan Michael E and Fagan Sharon L
Home Financials for this Owner
Home Financials are based on the most recent Mortgage that was taken out on this home.
Original Mortgage
$39,900
Interest Rate
8.25%
Mortgage Type
Stand Alone Second
Create a Home Valuation Report for This Property
The Home Valuation Report is an in-depth analysis detailing your home's value as well as a comparison with similar homes in the area
Purchase History
| Date | Buyer | Sale Price | Title Company |
|---|---|---|---|
| Jensen Jason Elleby | $265,000 | -- | |
| Fagan Michael E | -- | Landsafe Title |
Source: Public Records
Mortgage History
| Date | Status | Borrower | Loan Amount |
|---|---|---|---|
| Previous Owner | Jensen Jason Elleby | $242,077 | |
| Previous Owner | Fagan Michael E | $39,900 |
Source: Public Records
Tax History
| Year | Tax Paid | Tax Assessment Tax Assessment Total Assessment is a certain percentage of the fair market value that is determined by local assessors to be the total taxable value of land and additions on the property. | Land | Improvement |
|---|---|---|---|---|
| 2025 | $4,486 | $391,473 | $296,101 | $95,372 |
| 2024 | $4,486 | $383,798 | $290,296 | $93,502 |
| 2023 | $4,377 | $376,273 | $284,604 | $91,669 |
| 2022 | $4,345 | $368,896 | $279,024 | $89,872 |
| 2021 | $4,271 | $361,663 | $273,553 | $88,110 |
| 2020 | $4,247 | $357,955 | $270,748 | $87,207 |
| 2019 | $4,140 | $350,937 | $265,439 | $85,498 |
| 2018 | $4,078 | $344,056 | $260,234 | $83,822 |
| 2017 | $4,011 | $337,310 | $255,131 | $82,179 |
| 2016 | $3,929 | $330,697 | $250,129 | $80,568 |
| 2015 | $3,821 | $325,730 | $246,372 | $79,358 |
| 2014 | $3,712 | $319,350 | $241,546 | $77,804 |
Source: Public Records
Map
Nearby Homes
- 1467 W Roberta Ave
- 1501 S Royer Ave
- 1510 W Orangethorpe Ave
- 1919 W Coronet Ave Unit 75
- 1919 W Coronet Ave
- 1919 W Coronet Ave Unit 126
- 1919 W Coronet Ave Unit 190
- 1919 W Coronet Ave Unit 79
- 1207 W Woodcrest Ave
- 2057 W Coronet Ave
- 1955 W Clipper Ln
- 1935 W Clipper Ln Unit 50
- 1363 N Schooner Ln Unit 99
- 1360 Clementine Way
- 2136 W Clover Ave
- 1981 W Bayshore Dr
- 1875 W Falmouth Ave Unit 58
- 2210 W Coronet Ave
- 1850 W Orangethorpe Ave
- 1850 W Orangethorpe Ave Unit 24
- 1412 W Baker Ave
- 1400 W Baker Ave
- 1407 W Roberta Ave
- 1413 W Roberta Ave
- 1401 W Roberta Ave
- 1418 W Baker Ave
- 1407 W Baker Ave
- 1419 W Roberta Ave
- 1413 W Baker Ave
- 1401 W Baker Ave
- 1352 W Baker Ave
- 1419 W Baker Ave
- 1424 W Baker Ave
- 1353 W Roberta Ave
- 1425 W Roberta Ave
- 1425 W Baker Ave
- 1353 W Baker Ave
- 1406 W Roberta Ave
- 1346 W Baker Ave
- 1432 W Baker Ave
Your Personal Tour Guide
Ask me questions while you tour the home.