Estimated Value: $305,000 - $348,000
3
Beds
2
Baths
1,537
Sq Ft
$211/Sq Ft
Est. Value
About This Home
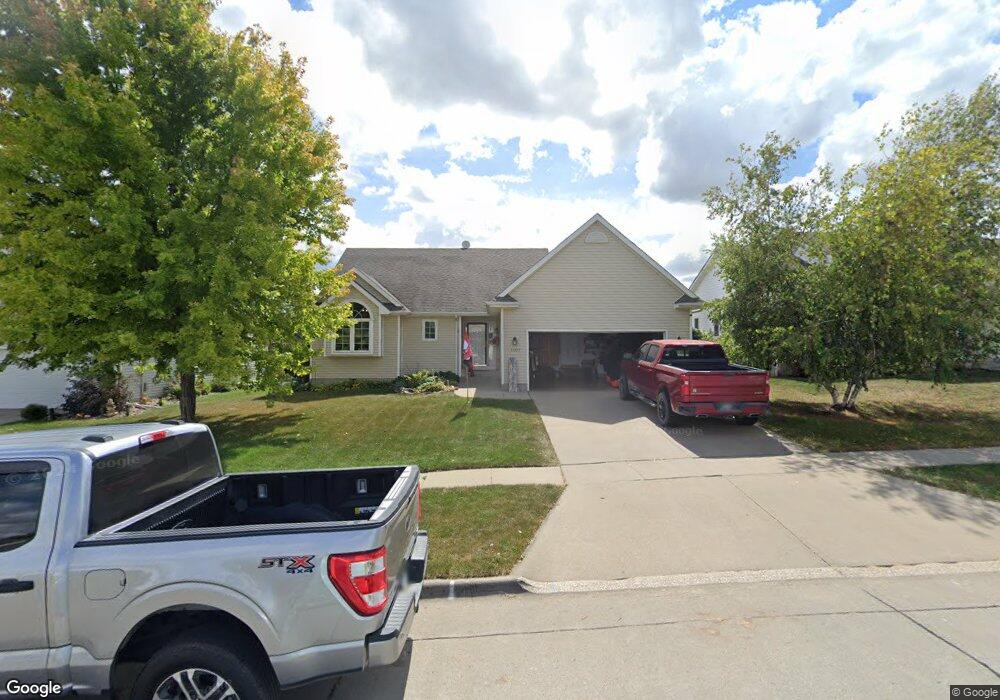
This home is located at 1407 Cedar Dr, Adel, IA 50003 and is currently estimated at $324,651, approximately $211 per square foot. 1407 Cedar Dr is a home located in Dallas County with nearby schools including Adel Elementary School, ADM Middle School, and DeSoto Intermediate School.
Ownership History
Date
Name
Owned For
Owner Type
Purchase Details
Closed on
Feb 5, 2024
Sold by
Jones Tige and Jones Angela
Bought by
Tige Jones And Angela Jones 2024 Revocable Tr
Current Estimated Value
Purchase Details
Closed on
Apr 26, 2005
Sold by
S C Stoner Construction Corp
Bought by
Jones Tige L and Jones Angela K
Home Financials for this Owner
Home Financials are based on the most recent Mortgage that was taken out on this home.
Original Mortgage
$162,420
Interest Rate
6.06%
Mortgage Type
New Conventional
Create a Home Valuation Report for This Property
The Home Valuation Report is an in-depth analysis detailing your home's value as well as a comparison with similar homes in the area
Home Values in the Area
Average Home Value in this Area
Purchase History
| Date | Buyer | Sale Price | Title Company |
|---|---|---|---|
| Tige Jones And Angela Jones 2024 Revocable Tr | -- | None Listed On Document | |
| Tige Jones And Angela Jones 2024 Revocable Tr | -- | None Listed On Document | |
| Jones Tige L | $203,500 | None Available |
Source: Public Records
Mortgage History
| Date | Status | Borrower | Loan Amount |
|---|---|---|---|
| Previous Owner | Jones Tige L | $162,420 |
Source: Public Records
Tax History
| Year | Tax Paid | Tax Assessment Tax Assessment Total Assessment is a certain percentage of the fair market value that is determined by local assessors to be the total taxable value of land and additions on the property. | Land | Improvement |
|---|---|---|---|---|
| 2025 | $5,074 | $306,620 | $55,000 | $251,620 |
| 2024 | $5,138 | $298,680 | $55,000 | $243,680 |
| 2023 | $5,138 | $302,790 | $50,000 | $252,790 |
| 2022 | $4,474 | $266,430 | $50,000 | $216,430 |
| 2021 | $4,474 | $235,030 | $50,000 | $185,030 |
| 2020 | $4,640 | $230,970 | $50,000 | $180,970 |
| 2019 | $4,652 | $230,970 | $50,000 | $180,970 |
| 2018 | $4,652 | $221,500 | $45,000 | $176,500 |
| 2017 | $4,338 | $221,500 | $45,000 | $176,500 |
| 2016 | $4,066 | $210,590 | $29,620 | $180,970 |
| 2015 | $4,080 | $201,450 | $0 | $0 |
| 2014 | $4,080 | $201,450 | $0 | $0 |
Source: Public Records
Map
Nearby Homes
- 1415 Maple Dr
- 1301 S 13th St
- 219 S 11th St
- 1407 Horse N Buggy Dr
- 1307 Greene St
- 923 S 10th St
- 820 Greenwood Hills Dr
- 2121 Greene St
- 402 S 11th St
- 1603 Chance Ct
- 818 Evans View Dr
- 1526 Chance Ct
- 219 S 12th St
- 1133 Prairie St
- 0 van Fossen Ln
- 811 Timberview Dr
- 1701 Main St
- 0 Highway 169
- 1105 Hunter Ct
- 729 Timberview Dr
Your Personal Tour Guide
Ask me questions while you tour the home.