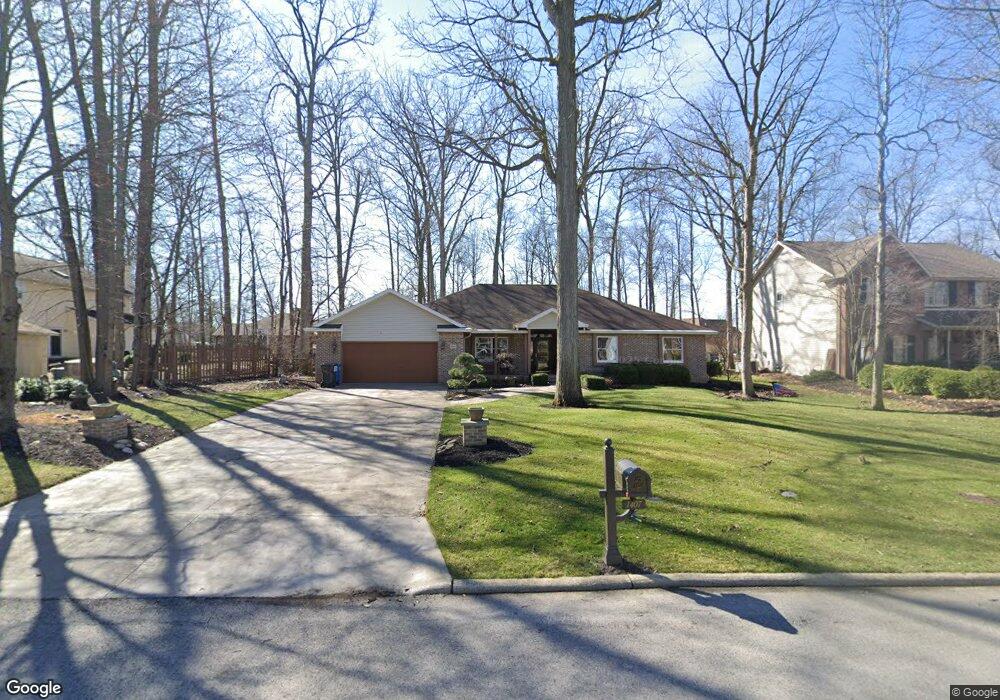
1407 Forest Park Findlay, OH 45840
Estimated Value: $332,000 - $414,000
3
Beds
2
Baths
2,109
Sq Ft
$178/Sq Ft
Est. Value
About This Home
This home is located at 1407 Forest Park, Findlay, OH 45840 and is currently estimated at $375,022, approximately $177 per square foot. 1407 Forest Park is a home located in Hancock County with nearby schools including Liberty-Benton Elementary School, Liberty-Benton Middle School, and Liberty-Benton High School.
Ownership History
Date
Name
Owned For
Owner Type
Purchase Details
Closed on
Jun 19, 2014
Sold by
Winkle Sandra K
Bought by
Winkle Sandra K
Current Estimated Value
Purchase Details
Closed on
Dec 21, 2001
Sold by
Birkhofer Brice G
Bought by
Winkle Sandra K
Home Financials for this Owner
Home Financials are based on the most recent Mortgage that was taken out on this home.
Original Mortgage
$156,000
Outstanding Balance
$60,731
Interest Rate
6.52%
Mortgage Type
New Conventional
Estimated Equity
$314,291
Purchase Details
Closed on
Mar 3, 1997
Sold by
Peltier Gerald
Bought by
Birchofer Brice and Birchofer Dawn
Home Financials for this Owner
Home Financials are based on the most recent Mortgage that was taken out on this home.
Original Mortgage
$158,160
Interest Rate
7.93%
Mortgage Type
New Conventional
Purchase Details
Closed on
Jan 4, 1994
Bought by
Peltier Gerald R and Peltier Nancy J
Purchase Details
Closed on
Jul 28, 1993
Bought by
Findlay Hillcrest Golf Crs
Create a Home Valuation Report for This Property
The Home Valuation Report is an in-depth analysis detailing your home's value as well as a comparison with similar homes in the area
Home Values in the Area
Average Home Value in this Area
Purchase History
| Date | Buyer | Sale Price | Title Company |
|---|---|---|---|
| Winkle Sandra K | -- | Attorney | |
| Winkle Sandra K | $195,000 | -- | |
| Birchofer Brice | $197,700 | -- | |
| Peltier Gerald R | $31,500 | -- | |
| Findlay Hillcrest Golf Crs | -- | -- |
Source: Public Records
Mortgage History
| Date | Status | Borrower | Loan Amount |
|---|---|---|---|
| Open | Winkle Sandra K | $156,000 | |
| Previous Owner | Birchofer Brice | $158,160 |
Source: Public Records
Tax History Compared to Growth
Tax History
| Year | Tax Paid | Tax Assessment Tax Assessment Total Assessment is a certain percentage of the fair market value that is determined by local assessors to be the total taxable value of land and additions on the property. | Land | Improvement |
|---|---|---|---|---|
| 2024 | $3,173 | $95,160 | $18,520 | $76,640 |
| 2023 | $3,121 | $95,160 | $18,520 | $76,640 |
| 2022 | $3,106 | $95,160 | $18,520 | $76,640 |
| 2021 | $2,803 | $77,590 | $18,520 | $59,070 |
| 2020 | $2,827 | $77,590 | $18,520 | $59,070 |
| 2019 | $2,712 | $77,590 | $18,520 | $59,070 |
| 2018 | $2,268 | $72,300 | $13,230 | $59,070 |
| 2017 | $1,331 | $72,300 | $13,230 | $59,070 |
| 2016 | $2,584 | $72,300 | $13,230 | $59,070 |
| 2015 | $2,558 | $69,860 | $13,970 | $55,890 |
| 2014 | $2,581 | $69,860 | $13,970 | $55,890 |
| 2012 | $2,696 | $69,860 | $13,970 | $55,890 |
Source: Public Records
Map
Nearby Homes
- 3106 Saddlebrook
- 1405 Cypress Lake
- 3018 Gleneagle Dr
- 1310 Muirfield Dr
- 6535 Silver Lake Dr
- 0 Bushwillow Dr Or Rock Candy Rd Unit Lot 157
- 0 Rock Candy Rd Or Bushwillow Dr Unit Lot 173
- 0 Bearcat Way Or Rock Candy Rd Unit Lot 167
- 0 Rock Candy Rd Unit Lot 159
- 0 Rock Candy Rd Unit Lot 170
- 0 Rock Candy Rd Unit Lot 172 206819
- 0 Rock Candy Rd Unit Lot 162
- 0 Rock Candy Rd Unit Lot 171
- 0 Rock Candy Rd Unit Lot 168
- 0 County Road 95 Unit 6097574
- 933 Laurel Ln
- 0 Allen Township 142
- 0 Township Highway 99
- 12325 Township Highway 99
- 3300 Crosshill Dr
- 1413 Forest Park
- 3216 Saddlebrook
- 3208 Saddlebrook
- 3207 Turnberry Dr
- 1419 Forest Park
- 1406 Forest Park
- 3200 Saddlebrook
- 1412 Forest Park
- 1400 Forest Park
- 3201 Turnberry Dr
- 0 Turnberry Dr Unit H127570
- 0 Turnberry Dr Unit H137348
- 3207 Saddlebrook
- 3205 Saddlebrook
- 1418 Forest Park
- 1312 Forest Park
- 3132 Saddlebrook
- 3201 Saddlebrook
- 3117 Turnberry Dr
- 1425 Silver Pine Ln