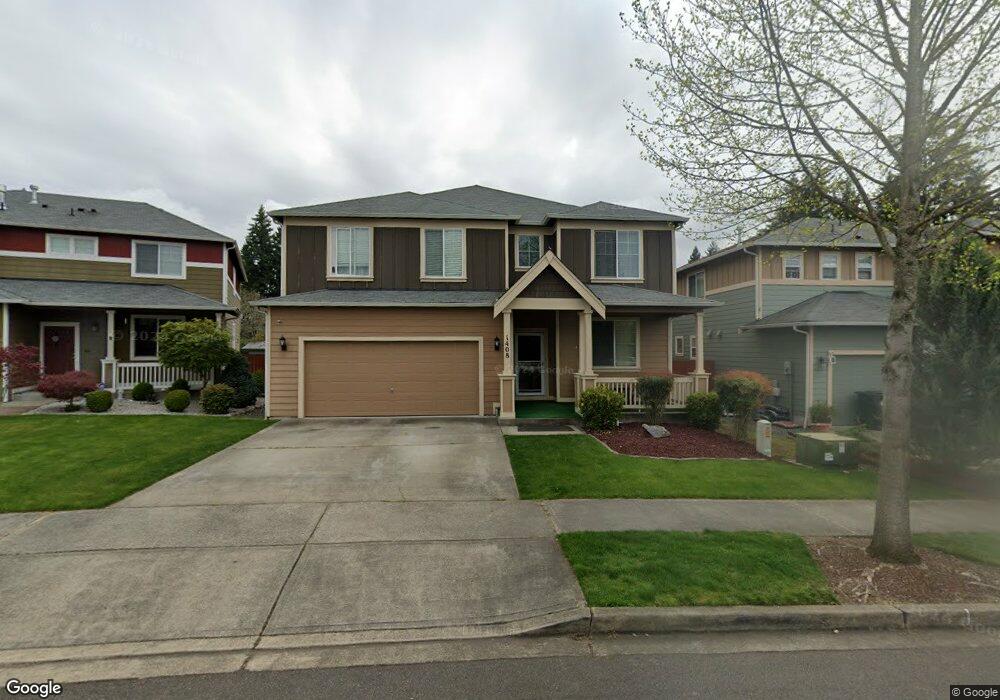
1408 Farina Loop SE Olympia, WA 98513
Meadows NeighborhoodEstimated Value: $590,963 - $642,000
4
Beds
3
Baths
3,115
Sq Ft
$198/Sq Ft
Est. Value
About This Home
This home is located at 1408 Farina Loop SE, Olympia, WA 98513 and is currently estimated at $618,241, approximately $198 per square foot. 1408 Farina Loop SE is a home located in Thurston County with nearby schools including Evergreen Forest Elementary School, Nisqually Middle School, and River Ridge High School.
Ownership History
Date
Name
Owned For
Owner Type
Purchase Details
Closed on
Oct 6, 2016
Sold by
Townsend James W and Townsend Vailau K
Bought by
Townsend James W and Townsend Vailau K
Current Estimated Value
Home Financials for this Owner
Home Financials are based on the most recent Mortgage that was taken out on this home.
Original Mortgage
$334,600
Outstanding Balance
$267,989
Interest Rate
3.43%
Mortgage Type
VA
Estimated Equity
$350,252
Purchase Details
Closed on
Jun 16, 2011
Sold by
Freestone Gbs Union Mills Llc
Bought by
Townsend James W and Keleise Vailau K
Home Financials for this Owner
Home Financials are based on the most recent Mortgage that was taken out on this home.
Original Mortgage
$319,678
Interest Rate
4.63%
Mortgage Type
VA
Create a Home Valuation Report for This Property
The Home Valuation Report is an in-depth analysis detailing your home's value as well as a comparison with similar homes in the area
Home Values in the Area
Average Home Value in this Area
Purchase History
| Date | Buyer | Sale Price | Title Company |
|---|---|---|---|
| Townsend James W | -- | First American | |
| Townsend James W | $312,950 | Chicago Title Company |
Source: Public Records
Mortgage History
| Date | Status | Borrower | Loan Amount |
|---|---|---|---|
| Open | Townsend James W | $334,600 | |
| Closed | Townsend James W | $319,678 |
Source: Public Records
Tax History Compared to Growth
Tax History
| Year | Tax Paid | Tax Assessment Tax Assessment Total Assessment is a certain percentage of the fair market value that is determined by local assessors to be the total taxable value of land and additions on the property. | Land | Improvement |
|---|---|---|---|---|
| 2024 | $5,032 | $533,600 | $122,300 | $411,300 |
| 2023 | $5,032 | $516,100 | $102,000 | $414,100 |
| 2022 | $5,483 | $497,700 | $55,000 | $442,700 |
| 2021 | $4,960 | $462,100 | $62,900 | $399,200 |
| 2020 | $4,663 | $389,200 | $62,200 | $327,000 |
| 2019 | $4,133 | $376,500 | $56,500 | $320,000 |
| 2018 | $4,721 | $340,800 | $44,200 | $296,600 |
| 2017 | $4,220 | $316,950 | $43,150 | $273,800 |
| 2016 | $4,374 | $341,950 | $42,950 | $299,000 |
| 2014 | -- | $323,150 | $42,950 | $280,200 |
Source: Public Records
Map
Nearby Homes
- 1434 Bedstone Dr SE
- 8938 Milbanke Dr SE
- 1546 Farina Loop SE
- 8424 14th Ave SE
- 8320 16th Ave SE
- 8235 Sweetbrier Loop SE
- 8348 Abington Loop SE
- 815 Gregory Way SE
- 934 Gregory Way SE
- 828 Gregory Way SE
- 1215 Gadwell Ct SE
- 2109 Ava St SE
- 2312 Carnbee Ct SE
- 8705 Fenwick Loop SE
- 1425 Goldenrod Dr SE
- 871 Spruce St SE
- 2131 Huntington Loop SE
- 8711 Fenwick Loop SE
- 8124 18th Ln SE Unit 142
- 1218 Mountain Aire Dr SE
- 1410 Farina Loop SE
- 1406 Farina Loop SE
- 1406 Farina Loop SE
- 1412 Farina Loop SE
- 1404 Farina Loop SE
- 8640 Graham Dr SE
- 1414 Farina Loop SE
- 1414 Farina Loop SE
- 1402 Farina Loop SE
- 8636 Graham Dr SE
- 1348 Farina Loop SE
- 1416 Farina Loop SE
- 1413 Farina Loop SE
- 8632 Graham Dr SE
- 1344 Farina Loop SE
- 1415 Farina Loop SE
- 1339 Farina Loop SE
- 8628 Graham Dr SE
- 8727 Pacific Ave SE
- 1416 Bedstone Dr SE