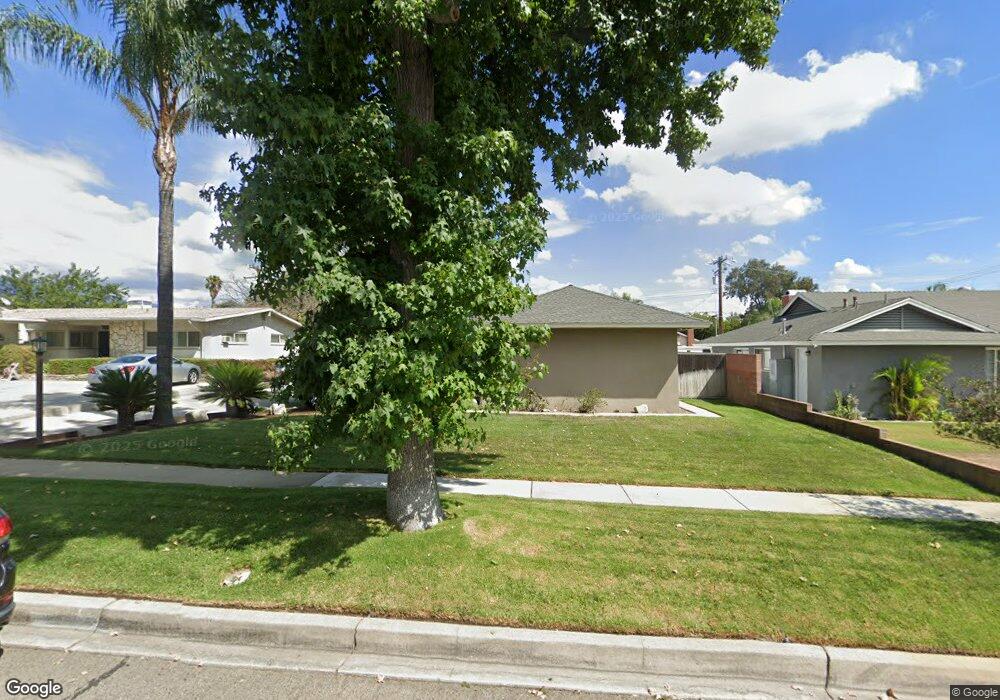
1408 Francis Ave Upland, CA 91786
Estimated Value: $805,000 - $878,000
4
Beds
2
Baths
1,823
Sq Ft
$463/Sq Ft
Est. Value
About This Home
This home is located at 1408 Francis Ave, Upland, CA 91786 and is currently estimated at $844,898, approximately $463 per square foot. 1408 Francis Ave is a home located in San Bernardino County with nearby schools including Sierra Vista Elementary School, Upland Junior High School, and Upland High School.
Ownership History
Date
Name
Owned For
Owner Type
Purchase Details
Closed on
Sep 2, 2009
Sold by
Bank Of America National Association
Bought by
Beatty Holly M and Busher Andrew
Current Estimated Value
Home Financials for this Owner
Home Financials are based on the most recent Mortgage that was taken out on this home.
Original Mortgage
$368,207
Interest Rate
5.5%
Mortgage Type
FHA
Purchase Details
Closed on
Aug 3, 2009
Sold by
Juarez Saul
Bought by
Bank Of America National Association
Home Financials for this Owner
Home Financials are based on the most recent Mortgage that was taken out on this home.
Original Mortgage
$368,207
Interest Rate
5.5%
Mortgage Type
FHA
Purchase Details
Closed on
Mar 15, 2005
Sold by
Martin David W and Martin Carol A
Bought by
Juarez Saul
Home Financials for this Owner
Home Financials are based on the most recent Mortgage that was taken out on this home.
Original Mortgage
$372,800
Interest Rate
6.37%
Mortgage Type
New Conventional
Create a Home Valuation Report for This Property
The Home Valuation Report is an in-depth analysis detailing your home's value as well as a comparison with similar homes in the area
Home Values in the Area
Average Home Value in this Area
Purchase History
| Date | Buyer | Sale Price | Title Company |
|---|---|---|---|
| Beatty Holly M | $375,000 | First American Title Company | |
| Bank Of America National Association | $369,600 | Accommodation | |
| Juarez Saul | $466,000 | Orange Coast Title Company |
Source: Public Records
Mortgage History
| Date | Status | Borrower | Loan Amount |
|---|---|---|---|
| Previous Owner | Beatty Holly M | $368,207 | |
| Previous Owner | Juarez Saul | $372,800 |
Source: Public Records
Tax History
| Year | Tax Paid | Tax Assessment Tax Assessment Total Assessment is a certain percentage of the fair market value that is determined by local assessors to be the total taxable value of land and additions on the property. | Land | Improvement |
|---|---|---|---|---|
| 2025 | $5,401 | $484,061 | $169,099 | $314,962 |
| 2024 | $5,230 | $474,569 | $165,783 | $308,786 |
| 2023 | $5,151 | $465,263 | $162,532 | $302,731 |
| 2022 | $5,040 | $456,140 | $159,345 | $296,795 |
| 2021 | $5,034 | $447,196 | $156,221 | $290,975 |
| 2020 | $4,898 | $442,610 | $154,619 | $287,991 |
| 2019 | $4,881 | $433,931 | $151,587 | $282,344 |
| 2018 | $4,763 | $425,423 | $148,615 | $276,808 |
| 2017 | $4,626 | $417,081 | $145,701 | $271,380 |
| 2016 | $4,412 | $408,903 | $142,844 | $266,059 |
| 2015 | $4,312 | $402,761 | $140,698 | $262,063 |
| 2014 | $4,201 | $394,872 | $137,942 | $256,930 |
Source: Public Records
Map
Nearby Homes
- 1377 N 5th Ave
- 655 Doreen Ct
- 171 E 14th St
- 1270 N Euclid Ave
- 1370 Edgefield St
- 1318 N Laurel Ave
- 769 Valadez St
- 1234 N Laurel Ave
- 929 E Foothill Blvd Unit 91
- 929 E Foothill Blvd Unit 15
- 929 E Foothill Blvd Unit 46
- 929 E Foothill Blvd Unit 161
- 929 E Foothill Blvd
- 929 E Foothill Blvd Unit 53
- 1382 Crawford Ave
- 1499 Alta Ave
- 1060 Pebble Beach Dr Unit 58
- 1629 N Palm Ave
- 910 N Redding Way Unit I
- 910 N Redding Way Unit F
- 1414 Francis Ave
- 1402 Francis Ave
- 1407 Winston Ct
- 1420 Francis Ave
- 1413 Winston Ct
- 1403 Winston Ct
- 1417 Winston Ct
- 1407 Francis Ave
- 1426 Francis Ave
- 1413 Francis Ave
- 359 E 14th St
- 1423 Winston Ct
- 386 E 14th St
- 374 E 14th St
- 1421 Francis Ave
- 422 E 14th St
- 1432 Francis Ave
- 358 E 14th St
- 1425 Francis Ave
- 1425 Francis Ave
Your Personal Tour Guide
Ask me questions while you tour the home.