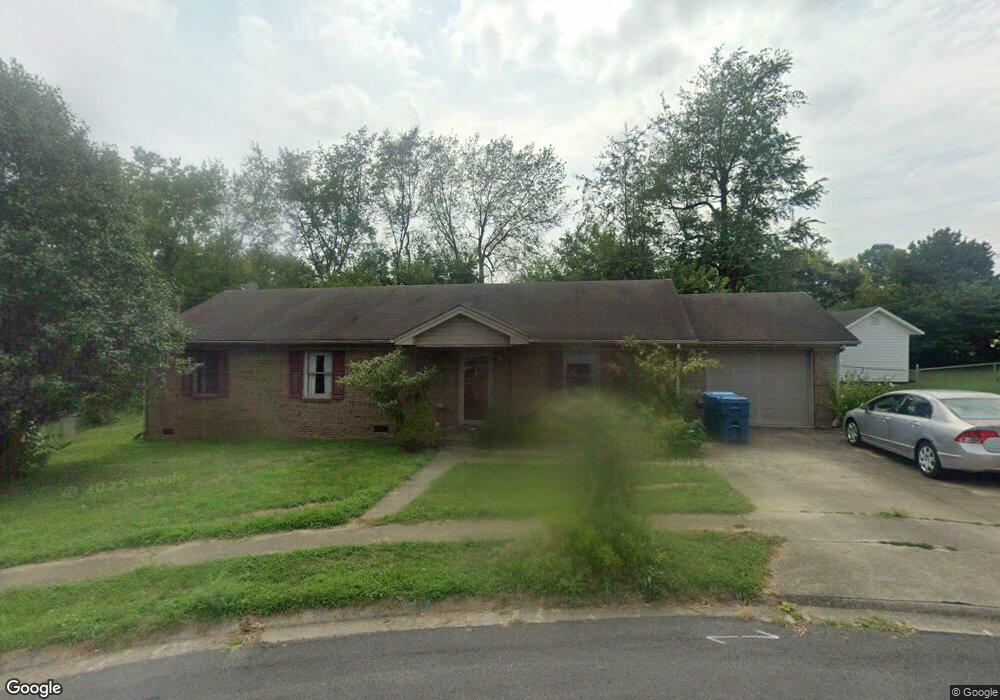
1408 John Ct Lawrenceburg, KY 40342
Estimated Value: $209,000 - $255,000
3
Beds
2
Baths
1,402
Sq Ft
$168/Sq Ft
Est. Value
About This Home
This home is located at 1408 John Ct, Lawrenceburg, KY 40342 and is currently estimated at $235,260, approximately $167 per square foot. 1408 John Ct is a home located in Anderson County with nearby schools including Saffell Street Elementary School, Emma B. Ward Elementary School, and Anderson County Middle School.
Ownership History
Date
Name
Owned For
Owner Type
Purchase Details
Closed on
Mar 4, 2016
Sold by
Crews Steven W and Howard Patty
Bought by
Johnson Jennifer
Current Estimated Value
Home Financials for this Owner
Home Financials are based on the most recent Mortgage that was taken out on this home.
Original Mortgage
$118,000
Outstanding Balance
$97,162
Interest Rate
3.72%
Mortgage Type
USDA
Estimated Equity
$138,098
Purchase Details
Closed on
Jan 13, 2012
Sold by
Perkins Mary Elizabeth
Bought by
Crews Steven W
Home Financials for this Owner
Home Financials are based on the most recent Mortgage that was taken out on this home.
Original Mortgage
$90,816
Interest Rate
4%
Purchase Details
Closed on
Dec 13, 2005
Sold by
The Lawrenceburg National Bank
Bought by
Perkins Mary Elizabeth
Purchase Details
Closed on
Nov 7, 2005
Sold by
Crews Steven W and Crews Kelli F
Bought by
The Lawrenceburg National Bank
Create a Home Valuation Report for This Property
The Home Valuation Report is an in-depth analysis detailing your home's value as well as a comparison with similar homes in the area
Home Values in the Area
Average Home Value in this Area
Purchase History
| Date | Buyer | Sale Price | Title Company |
|---|---|---|---|
| Johnson Jennifer | $115,000 | Attorney | |
| Crews Steven W | $89,000 | -- | |
| Perkins Mary Elizabeth | $104,000 | -- | |
| The Lawrenceburg National Bank | $10,145,827 | -- |
Source: Public Records
Mortgage History
| Date | Status | Borrower | Loan Amount |
|---|---|---|---|
| Open | Johnson Jennifer | $118,000 | |
| Previous Owner | Crews Steven W | $90,816 |
Source: Public Records
Tax History Compared to Growth
Tax History
| Year | Tax Paid | Tax Assessment Tax Assessment Total Assessment is a certain percentage of the fair market value that is determined by local assessors to be the total taxable value of land and additions on the property. | Land | Improvement |
|---|---|---|---|---|
| 2024 | $1,347 | $145,000 | $25,000 | $120,000 |
| 2023 | $1,367 | $145,000 | $25,000 | $120,000 |
| 2022 | $1,206 | $125,000 | $25,000 | $100,000 |
| 2021 | $1,139 | $115,000 | $25,000 | $90,000 |
| 2020 | $1,168 | $115,000 | $25,000 | $90,000 |
| 2019 | $1,188 | $115,000 | $25,000 | $90,000 |
| 2018 | $1,176 | $115,000 | $25,000 | $90,000 |
| 2017 | $1,156 | $115,000 | $25,000 | $90,000 |
| 2016 | $1,136 | $115,000 | $25,000 | $90,000 |
| 2015 | $1,063 | $110,000 | $25,000 | $85,000 |
| 2014 | $1,060 | $110,000 | $25,000 | $85,000 |
| 2013 | $1,045 | $110,000 | $25,000 | $85,000 |
Source: Public Records
Map
Nearby Homes
- 3104 Fawn Leap Dr
- 203 Bluebird Ct
- 113 Cardinal Dr
- 1048 Indian Trail
- 1030 Indian Trail
- 208 Poplar Dr
- 509 Hickory Rd
- 50.86 Walker Ln
- 308 E Woodford St
- 309 E Woodford St
- 307 E Woodford St
- 1102 Riva Ridge Dr
- 507 E Court St
- Lot 30 Georgia Way
- 1000 Paddock Loop
- Lot 29 Georgia Way
- 28 Freestone Way
- 1017 Sea Biscuit Dr
- Lot 26 Georgia Way
- 218 E Woodford St