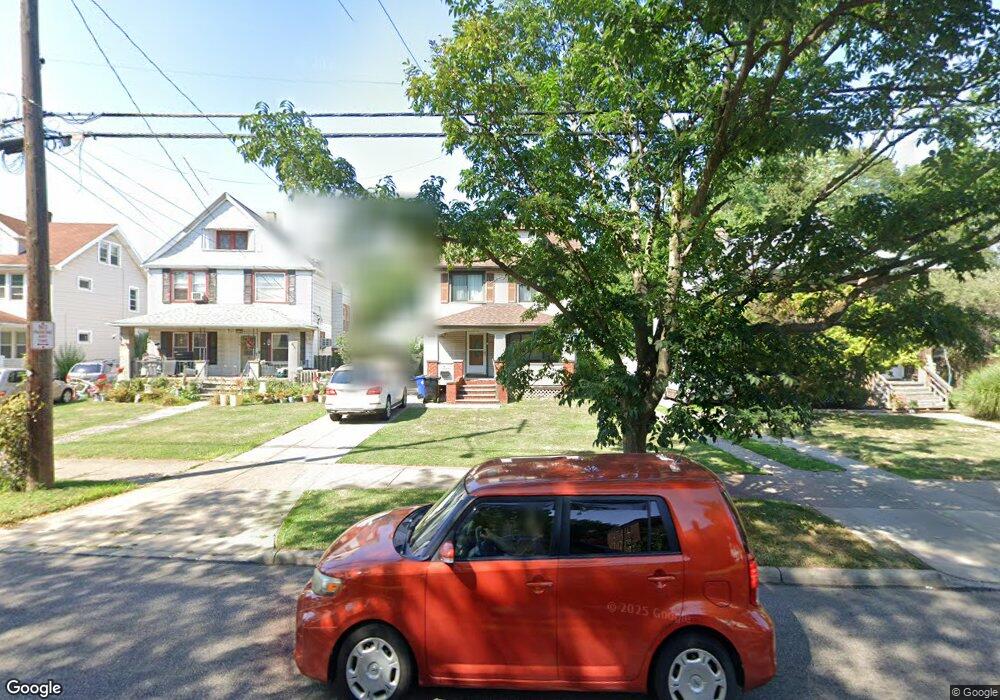
1408 Spring Rd Cleveland, OH 44109
Old Brooklyn NeighborhoodEstimated Value: $127,007 - $209,000
3
Beds
2
Baths
1,360
Sq Ft
$135/Sq Ft
Est. Value
About This Home
This home is located at 1408 Spring Rd, Cleveland, OH 44109 and is currently estimated at $184,002, approximately $135 per square foot. 1408 Spring Rd is a home located in Cuyahoga County with nearby schools including Constellation Schools: Old Brooklyn Community Middle School, Mary Queen Of Peace School, and Luther Memorial School.
Ownership History
Date
Name
Owned For
Owner Type
Purchase Details
Closed on
Aug 18, 2009
Sold by
Maroun Elias N and Maroun Roxanne T
Bought by
Quest Property Management & Consulting L
Current Estimated Value
Purchase Details
Closed on
May 8, 2009
Sold by
Maroun Chadi and Maroun Jessica
Bought by
Maroun Elias N
Purchase Details
Closed on
Dec 10, 2007
Sold by
Deutsche Bank National Trust Co
Bought by
Maroun Chadi
Purchase Details
Closed on
Jul 6, 2007
Sold by
Hruby Robert B and Wakut Irene N
Bought by
Deutsche Bank National Trust Co
Purchase Details
Closed on
Jan 5, 2005
Sold by
Hruby Robert B
Bought by
Hruby Robert B and Wakut Irene N
Purchase Details
Closed on
Jul 25, 2003
Sold by
Wakut Irene N
Bought by
Hruby Robert B
Purchase Details
Closed on
Dec 15, 1989
Sold by
Toth James D and Toth Rosemarie
Bought by
Wakut Irene M
Purchase Details
Closed on
Jan 1, 1975
Bought by
Toth James D and Toth Rosemarie
Create a Home Valuation Report for This Property
The Home Valuation Report is an in-depth analysis detailing your home's value as well as a comparison with similar homes in the area
Home Values in the Area
Average Home Value in this Area
Purchase History
| Date | Buyer | Sale Price | Title Company |
|---|---|---|---|
| Quest Property Management & Consulting L | -- | Attorney | |
| Maroun Elias N | -- | Attorney | |
| Maroun Chadi | $40,000 | Sovereign Title Agency Llc | |
| Deutsche Bank National Trust Co | $46,667 | Ohio Title Corp | |
| Hruby Robert B | -- | Cleveland Home Title | |
| Hruby Robert B | -- | Cleveland Home Title Agency | |
| Wakut Irene M | $45,500 | -- | |
| Toth James D | -- | -- |
Source: Public Records
Tax History
| Year | Tax Paid | Tax Assessment Tax Assessment Total Assessment is a certain percentage of the fair market value that is determined by local assessors to be the total taxable value of land and additions on the property. | Land | Improvement |
|---|---|---|---|---|
| 2024 | $2,341 | $35,000 | $7,875 | $27,125 |
| 2023 | $1,710 | $22,060 | $5,710 | $16,350 |
| 2022 | $1,701 | $22,050 | $5,705 | $16,345 |
| 2021 | $1,685 | $22,050 | $5,710 | $16,350 |
| 2020 | $1,509 | $17,080 | $4,410 | $12,670 |
| 2019 | $1,397 | $48,800 | $12,600 | $36,200 |
| 2018 | $1,393 | $17,080 | $4,410 | $12,670 |
| 2017 | $1,439 | $17,020 | $3,470 | $13,550 |
| 2016 | $1,428 | $17,020 | $3,470 | $13,550 |
| 2015 | $1,592 | $17,020 | $3,470 | $13,550 |
| 2014 | $1,592 | $18,900 | $3,850 | $15,050 |
Source: Public Records
Map
Nearby Homes
- 1301 Spring Rd
- 4475 W 12th St
- 4498 S Hills Dr
- 1825 Treadway Ave
- 2007 Tate Ave
- 1209 Birch Ln
- 1115 Birch Ln
- 2027 Treadway Ave
- 624 Timothy Ln
- 4233 Valley Rd
- 1717 Tarlton Ave
- 2302 Hood Ave
- 1711 Ardoyne Ave
- 4270 Valley Rd
- 2300 Roanoke Ave
- 833 Sheryl Dr
- 4342 Sky Lane Dr
- 2609 Hood Ave
- 1703 Crestline Ave
- 858 Marcie Dr
- 1404 Spring Rd
- 1410 Spring Rd
- 1406 Spring Rd
- 1414 Spring Rd
- 1416 Spring Rd
- 1517 Ferman Ave
- 1513 Ferman Ave
- 1521 Ferman Ave
- 1316 Spring Rd
- 4433 S Hills Dr
- 1509 Ferman Ave
- 1418 Spring Rd
- 1409 Spring Rd
- 1413 Spring Rd
- 1403 Spring Rd
- 1310 Spring Rd
- 1417 Spring Rd
- 1505 Ferman Ave
- 4425 S Hills Dr
- 1407 Spring Rd
Your Personal Tour Guide
Ask me questions while you tour the home.