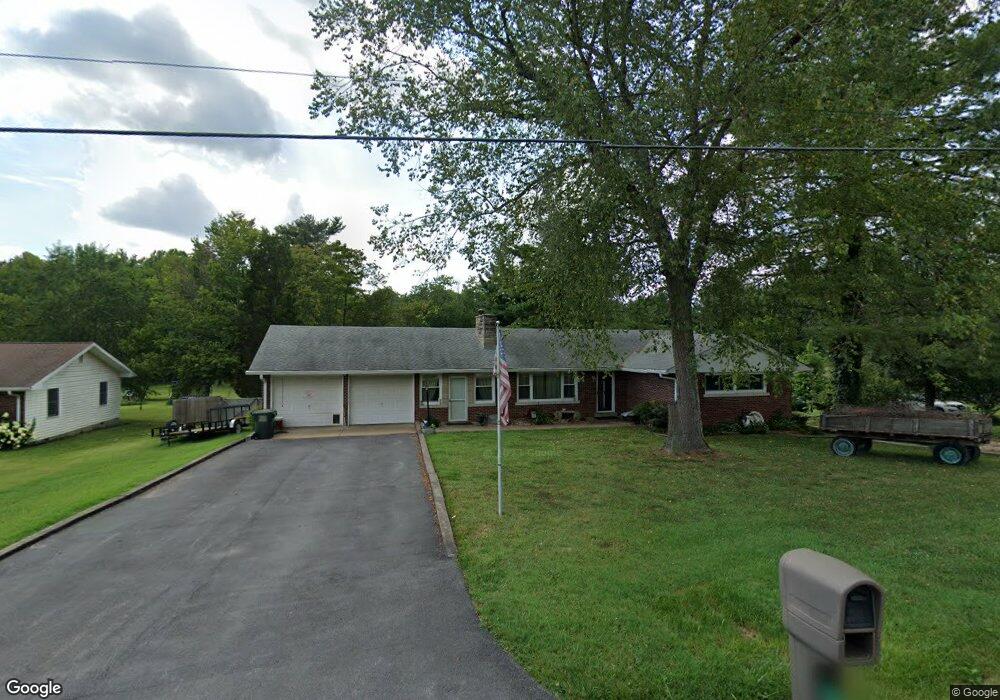
1408 Tupman Rd Evansville, IN 47720
Estimated Value: $238,000 - $277,000
3
Beds
1
Bath
1,528
Sq Ft
$167/Sq Ft
Est. Value
About This Home
This home is located at 1408 Tupman Rd, Evansville, IN 47720 and is currently estimated at $255,295, approximately $167 per square foot. 1408 Tupman Rd is a home located in Vanderburgh County with nearby schools including West Terrace Elementary School, Perry Heights Middle School, and Francis Joseph Reitz High School.
Ownership History
Date
Name
Owned For
Owner Type
Purchase Details
Closed on
Jan 10, 2024
Sold by
Naas Amy
Bought by
Naas Michael D
Current Estimated Value
Home Financials for this Owner
Home Financials are based on the most recent Mortgage that was taken out on this home.
Original Mortgage
$59,000
Outstanding Balance
$54,838
Interest Rate
6.29%
Mortgage Type
Credit Line Revolving
Estimated Equity
$200,457
Purchase Details
Closed on
May 21, 2021
Sold by
Naas Michael D
Bought by
Naas Michael D and Naas Amy
Home Financials for this Owner
Home Financials are based on the most recent Mortgage that was taken out on this home.
Original Mortgage
$135,000
Interest Rate
3%
Mortgage Type
New Conventional
Purchase Details
Closed on
Sep 11, 2007
Sold by
Branson Dorothy
Bought by
Naas Michale
Home Financials for this Owner
Home Financials are based on the most recent Mortgage that was taken out on this home.
Original Mortgage
$143,111
Interest Rate
6.57%
Mortgage Type
FHA
Create a Home Valuation Report for This Property
The Home Valuation Report is an in-depth analysis detailing your home's value as well as a comparison with similar homes in the area
Home Values in the Area
Average Home Value in this Area
Purchase History
| Date | Buyer | Sale Price | Title Company |
|---|---|---|---|
| Naas Michael D | -- | None Listed On Document | |
| Naas Michael D | -- | None Available | |
| Naas Michael D | -- | None Available | |
| Naas Michale | -- | None Available |
Source: Public Records
Mortgage History
| Date | Status | Borrower | Loan Amount |
|---|---|---|---|
| Open | Naas Michael D | $59,000 | |
| Previous Owner | Naas Michael D | $135,000 | |
| Previous Owner | Naas Michale | $143,111 |
Source: Public Records
Tax History Compared to Growth
Tax History
| Year | Tax Paid | Tax Assessment Tax Assessment Total Assessment is a certain percentage of the fair market value that is determined by local assessors to be the total taxable value of land and additions on the property. | Land | Improvement |
|---|---|---|---|---|
| 2024 | $1,701 | $181,600 | $33,900 | $147,700 |
| 2023 | $1,764 | $177,300 | $33,900 | $143,400 |
| 2022 | $1,863 | $178,100 | $33,900 | $144,200 |
| 2021 | $1,891 | $166,000 | $33,900 | $132,100 |
| 2020 | $1,818 | $166,000 | $33,900 | $132,100 |
| 2019 | $1,813 | $166,300 | $33,900 | $132,400 |
| 2018 | $1,786 | $166,600 | $33,900 | $132,700 |
| 2017 | $1,752 | $164,800 | $33,900 | $130,900 |
| 2016 | $1,685 | $163,900 | $32,900 | $131,000 |
| 2014 | $1,650 | $162,800 | $32,900 | $129,900 |
| 2013 | -- | $154,100 | $32,900 | $121,200 |
Source: Public Records
Map
Nearby Homes
- 4619 Upper Mount Vernon Rd
- 5300 Hogue Rd
- 5933 Krueger Ave
- 5601 W Haven Dr
- 2521 N Red Bank Rd
- 1113 N Werner Ave
- 5335 Nunning Ct
- 5200 W Haven Dr
- 3908 W Maryland St
- 2722 N Red Bank Rd
- 1630 Harmony Way
- 5633 Forest Ave
- 1706 Harmony Way
- 304 N Tekoppel Ave
- 3400 Mount Vernon Ave
- 214 S Bosse Ave
- 301 S Elm Ave
- 203 Althaus Ave
- 3525 Koring Rd
- 809 Harmony Way
- 1414 Tupman Rd
- 1400 Tupman Rd
- 1420 Tupman Rd
- 1413 Tupman Rd
- 1314 Tupman Rd
- 1429 Tupman Rd
- 1321 Tupman Rd
- 1508 Tupman Rd
- 1300 Tupman Rd
- 1315 Tupman Rd
- 1401 Tupman Rd
- 1309 Tupman Rd
- 5200 Mattingly Ct
- 1212 Tupman Rd
- 1301 Tupman Rd
- 1221 Tupman Rd
- 1213 Tupman Rd
- 5212 Mattingly Ct
- 1302 Tupman Rd
- 1300 N Red Bank Rd