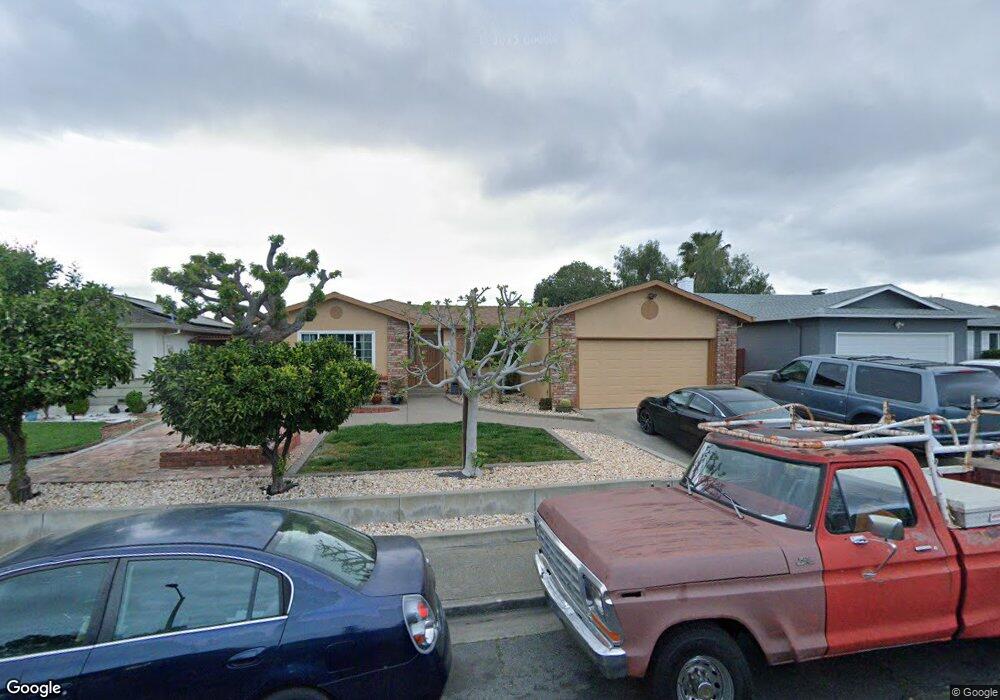
1409 Aster Dr Antioch, CA 94509
North Antioch NeighborhoodEstimated Value: $490,000 - $553,000
3
Beds
2
Baths
1,406
Sq Ft
$362/Sq Ft
Est. Value
About This Home
This home is located at 1409 Aster Dr, Antioch, CA 94509 and is currently estimated at $508,690, approximately $361 per square foot. 1409 Aster Dr is a home located in Contra Costa County with nearby schools including Fremont Elementary School, Antioch Middle School, and Antioch High School.
Ownership History
Date
Name
Owned For
Owner Type
Purchase Details
Closed on
Jul 22, 1997
Sold by
Va
Bought by
Zuniga Samuel and Zuniga Maria L
Current Estimated Value
Home Financials for this Owner
Home Financials are based on the most recent Mortgage that was taken out on this home.
Original Mortgage
$117,050
Outstanding Balance
$16,893
Interest Rate
7.58%
Mortgage Type
Seller Take Back
Estimated Equity
$491,797
Purchase Details
Closed on
Mar 19, 1997
Sold by
Cue Jo Ann B
Bought by
Countrywide Home Loans Inc
Create a Home Valuation Report for This Property
The Home Valuation Report is an in-depth analysis detailing your home's value as well as a comparison with similar homes in the area
Home Values in the Area
Average Home Value in this Area
Purchase History
| Date | Buyer | Sale Price | Title Company |
|---|---|---|---|
| Zuniga Samuel | $118,500 | -- | |
| Countrywide Home Loans Inc | $79,457 | Benefit Land Title Ins Co |
Source: Public Records
Mortgage History
| Date | Status | Borrower | Loan Amount |
|---|---|---|---|
| Open | Zuniga Samuel | $117,050 |
Source: Public Records
Tax History
| Year | Tax Paid | Tax Assessment Tax Assessment Total Assessment is a certain percentage of the fair market value that is determined by local assessors to be the total taxable value of land and additions on the property. | Land | Improvement |
|---|---|---|---|---|
| 2025 | $2,613 | $189,183 | $55,869 | $133,314 |
| 2024 | $2,461 | $185,474 | $54,774 | $130,700 |
| 2023 | $2,461 | $181,838 | $53,700 | $128,138 |
| 2022 | $2,425 | $178,274 | $52,648 | $125,626 |
| 2021 | $2,329 | $174,779 | $51,616 | $123,163 |
| 2019 | $2,283 | $169,597 | $50,086 | $119,511 |
| 2018 | $2,201 | $166,272 | $49,104 | $117,168 |
| 2017 | $2,139 | $163,013 | $48,142 | $114,871 |
| 2016 | $2,079 | $159,818 | $47,199 | $112,619 |
| 2015 | $2,051 | $157,419 | $46,491 | $110,928 |
| 2014 | $1,986 | $154,337 | $45,581 | $108,756 |
Source: Public Records
Map
Nearby Homes
- 1508 Sycamore Dr
- 1504 Sycamore Dr
- 1216 Sycamore Dr Unit 4
- 2104 Lemontree Way Unit 1
- 2208 Spanos St
- 2108 Lemontree Way Unit 3
- 2217 Manzanita Way
- 2110 Peppertree Way Unit 1
- 2118 Peppertree Way Unit 4
- 2118 Peppertree Way Unit 1
- 1112 W 6th St
- 2205 Lemontree Way Unit 3
- 1143 Cook St
- 2122 Peppertree Way Unit 2
- 2205 Peppertree Way Unit 1
- 2405 Sunny Ln Unit 3
- 2209 Peppertree Way Unit 4
- 2304 Peppertree Way Unit 4
- 2416 Shadow Ln Unit 74
- 2416 Shadow Ln
Your Personal Tour Guide
Ask me questions while you tour the home.