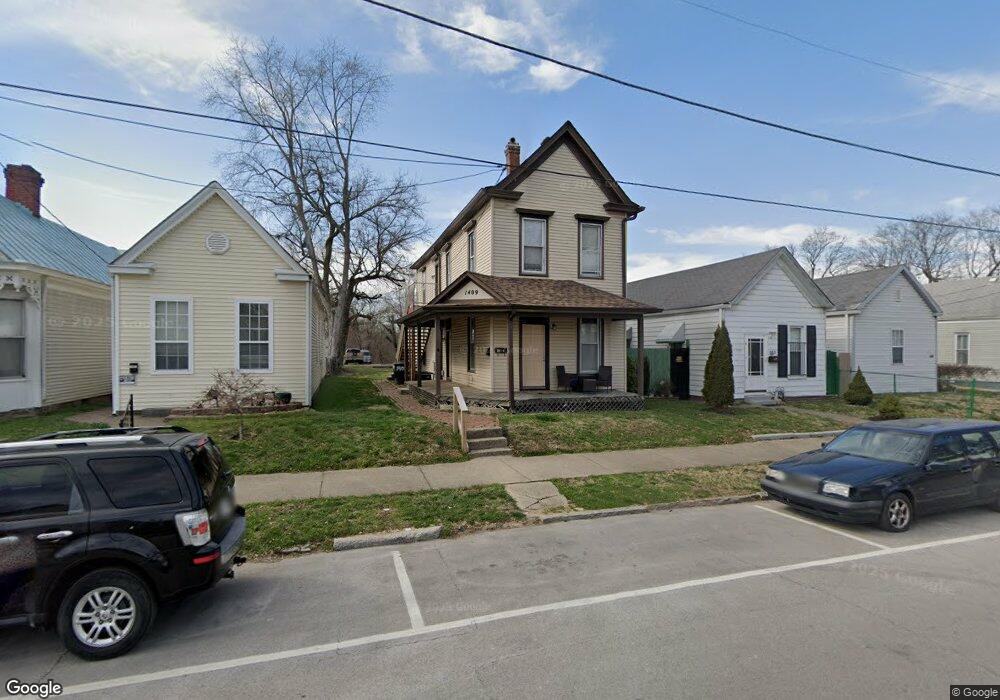
1409 Chartres St New Albany, IN 47150
Estimated Value: $144,000 - $219,000
2
Beds
2
Baths
1,696
Sq Ft
$109/Sq Ft
Est. Value
About This Home
This home is located at 1409 Chartres St, New Albany, IN 47150 and is currently estimated at $184,061, approximately $108 per square foot. 1409 Chartres St is a home located in Floyd County with nearby schools including S. Ellen Jones Elementary School, Hazelwood Middle School, and New Albany Senior High School.
Ownership History
Date
Name
Owned For
Owner Type
Purchase Details
Closed on
Jun 28, 2018
Sold by
Mccall Sean Michael
Bought by
Scott David Paul
Current Estimated Value
Purchase Details
Closed on
Aug 6, 2012
Sold by
Mccall Erin L
Bought by
Mccall Sean Michael
Purchase Details
Closed on
Jul 12, 2005
Sold by
Shumaker Lee E and Shumaker Ruth A
Bought by
Mccall Sean M and Mccall Erin L
Home Financials for this Owner
Home Financials are based on the most recent Mortgage that was taken out on this home.
Original Mortgage
$59,678
Interest Rate
5.69%
Mortgage Type
Purchase Money Mortgage
Create a Home Valuation Report for This Property
The Home Valuation Report is an in-depth analysis detailing your home's value as well as a comparison with similar homes in the area
Home Values in the Area
Average Home Value in this Area
Purchase History
| Date | Buyer | Sale Price | Title Company |
|---|---|---|---|
| Scott David Paul | -- | None Available | |
| Mccall Sean Michael | -- | None Available | |
| Mccall Sean M | -- | Wt&S Title |
Source: Public Records
Mortgage History
| Date | Status | Borrower | Loan Amount |
|---|---|---|---|
| Previous Owner | Mccall Sean M | $59,678 |
Source: Public Records
Tax History Compared to Growth
Tax History
| Year | Tax Paid | Tax Assessment Tax Assessment Total Assessment is a certain percentage of the fair market value that is determined by local assessors to be the total taxable value of land and additions on the property. | Land | Improvement |
|---|---|---|---|---|
| 2024 | $2,096 | $98,700 | $9,100 | $89,600 |
| 2023 | $2,361 | $110,600 | $9,100 | $101,500 |
| 2022 | $2,311 | $108,200 | $9,100 | $99,100 |
| 2021 | $1,948 | $90,500 | $9,100 | $81,400 |
| 2020 | $1,951 | $90,500 | $9,100 | $81,400 |
| 2019 | $1,957 | $90,700 | $9,100 | $81,600 |
| 2018 | $1,945 | $89,600 | $9,100 | $80,500 |
| 2017 | $1,981 | $89,700 | $9,100 | $80,600 |
| 2016 | $1,776 | $88,800 | $9,100 | $79,700 |
| 2014 | $1,128 | $56,400 | $9,100 | $47,300 |
| 2013 | -- | $54,800 | $9,100 | $45,700 |
Source: Public Records
Map
Nearby Homes
- 1314 Chartres St
- 1406 Chartres St
- 1412 Chartres St
- 1120 Chartres St
- 830 Cedar Bough Place
- 1205 Ekin Ave
- 1119 Ekin Ave
- 1314 Ekin Ave
- 1011 Vincennes St Unit 5
- 1313 Culbertson Ave
- 1605 Culbertson Ave
- 608 E Oak St
- 1711 Charlestown Rd
- 418 E 13th St
- 1727 E Oak St
- 416 E 11th St
- 1261 Vance Ave
- 1809 E Oak St
- 1748 E Oak St
- 1918 Charlestown Rd
- 1407 Chartres St
- 1411 Chartres St
- 1405 Chartres St
- 1413 Chartres St
- 1401 Chartres St
- 1415 Chartres St
- 1315 Chartres St
- 1419 Chartres St
- 1311 Chartres St
- 1421 Chartres St
- 1408 Chartres St
- 1314 E 8th St
- 1404 Chartres St
- 1309 Chartres St
- 1422 E 8th St
- 1402 Chartres St
- 1423 Chartres St
- 1316 Chartres St
- 1307 Chartres St
- 1420 Chartres St