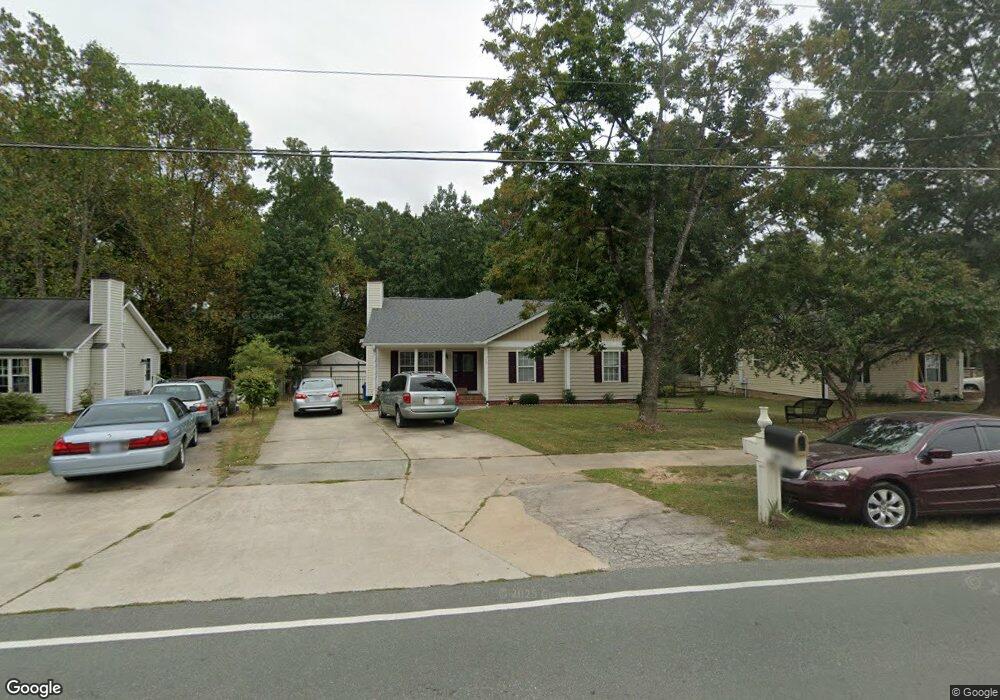
1409 Ed Cook Rd Durham, NC 27703
Estimated Value: $449,000 - $475,000
4
Beds
3
Baths
2,370
Sq Ft
$196/Sq Ft
Est. Value
About This Home
This home is located at 1409 Ed Cook Rd, Durham, NC 27703 and is currently estimated at $463,540, approximately $195 per square foot. 1409 Ed Cook Rd is a home located in Durham County with nearby schools including R.N. Harris Elementary School, James E. Shepard Middle School, and Hillside High School.
Ownership History
Date
Name
Owned For
Owner Type
Purchase Details
Closed on
Aug 12, 2024
Sold by
Cruz Leopoldo Martinez
Bought by
Martinez Alba Cristina
Current Estimated Value
Purchase Details
Closed on
Jun 2, 2014
Sold by
Rosa Gavino Dela and Berrones Aquilina
Bought by
Martinez Cruz Leopoldo
Home Financials for this Owner
Home Financials are based on the most recent Mortgage that was taken out on this home.
Original Mortgage
$177,650
Interest Rate
4.32%
Mortgage Type
New Conventional
Purchase Details
Closed on
Nov 14, 2000
Sold by
Village Custom Homes Company
Bought by
Delarosa Gavino and Berrones Aquilina
Home Financials for this Owner
Home Financials are based on the most recent Mortgage that was taken out on this home.
Original Mortgage
$124,600
Interest Rate
7.83%
Mortgage Type
FHA
Create a Home Valuation Report for This Property
The Home Valuation Report is an in-depth analysis detailing your home's value as well as a comparison with similar homes in the area
Home Values in the Area
Average Home Value in this Area
Purchase History
| Date | Buyer | Sale Price | Title Company |
|---|---|---|---|
| Martinez Alba Cristina | -- | None Listed On Document | |
| Martinez Cruz Leopoldo | $187,000 | None Available | |
| Delarosa Gavino | $125,000 | -- |
Source: Public Records
Mortgage History
| Date | Status | Borrower | Loan Amount |
|---|---|---|---|
| Previous Owner | Martinez Cruz Leopoldo | $177,650 | |
| Previous Owner | Delarosa Gavino | $124,600 |
Source: Public Records
Tax History Compared to Growth
Tax History
| Year | Tax Paid | Tax Assessment Tax Assessment Total Assessment is a certain percentage of the fair market value that is determined by local assessors to be the total taxable value of land and additions on the property. | Land | Improvement |
|---|---|---|---|---|
| 2025 | $4,685 | $472,601 | $148,200 | $324,401 |
| 2024 | $3,613 | $259,020 | $31,280 | $227,740 |
| 2023 | $3,393 | $259,020 | $31,280 | $227,740 |
| 2022 | $3,315 | $259,020 | $31,280 | $227,740 |
| 2021 | $3,300 | $259,020 | $31,280 | $227,740 |
| 2020 | $3,222 | $259,020 | $31,280 | $227,740 |
| 2019 | $3,222 | $259,020 | $31,280 | $227,740 |
| 2018 | $2,622 | $193,264 | $23,460 | $169,804 |
| 2017 | $2,602 | $193,264 | $23,460 | $169,804 |
| 2016 | $2,515 | $193,264 | $23,460 | $169,804 |
| 2015 | $3,304 | $238,707 | $24,640 | $214,067 |
| 2014 | $3,304 | $238,707 | $24,640 | $214,067 |
Source: Public Records
Map
Nearby Homes
- 7 Mint Hill Ct
- 1905 Edgerton Dr
- 1206 Ellis Rd
- 1202 Ellis Rd
- 1412 Scholar Dr
- 1365 Scholar Dr
- 2401 Southern Dr
- 3004 Cypress Lagoon Ct
- 1403 Sunset Peak Way
- 104 Brennan Ct
- 304 Garden Walk Dr
- 2513 Magnolia Tree Ln
- 229 Zante Currant Rd
- 2605 Magnolia Tree Ln
- 112 Churment Ct
- 130 Holly Berry Ln
- 2002 Strickland Oak Way
- 3306 Opal Dr
- 3304 Opal Dr
- 3300 Opal Dr
- 1413 Ed Cook Rd
- 1405 Ed Cook Rd
- 1417 Ed Cook Rd
- 1403 Ed Cook Rd
- 1408 Ed Cook Rd
- 1501 Ed Cook Rd
- 1401 Ed Cook Rd
- 1412 Ed Cook Rd
- 1503 Ed Cook Rd
- 1400 Ed Cook Rd
- 1317 Ed Cook Rd
- 1326 Ellis Rd
- 1330 Ellis Rd
- 1500 Ed Cook Rd
- 1505 Ed Cook Rd
- 1926 Edgerton Dr
- 1315 Ed Cook Rd
- 1925 Leonard Dr
- 1324 Ellis Rd
- 1334 Ellis Rd