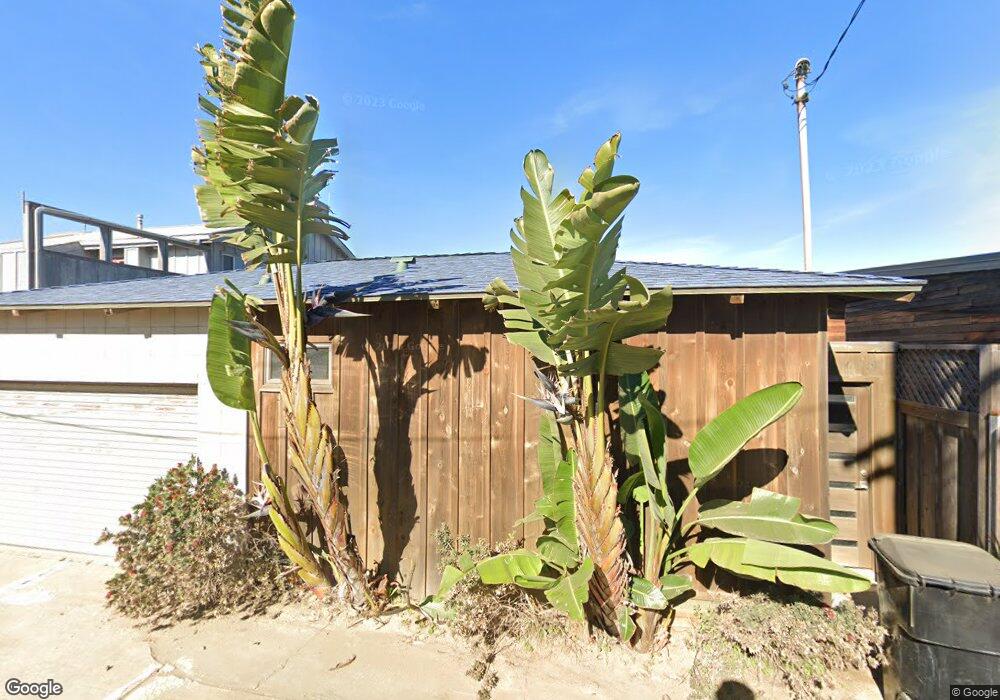
1409 Ocean Front St San Diego, CA 92107
Ocean Beach NeighborhoodEstimated Value: $1,516,000 - $3,034,000
3
Beds
2
Baths
2,481
Sq Ft
$793/Sq Ft
Est. Value
About This Home
This home is located at 1409 Ocean Front St, San Diego, CA 92107 and is currently estimated at $1,968,469, approximately $793 per square foot. 1409 Ocean Front St is a home located in San Diego County with nearby schools including Sunset View Elementary School, Richard Henry Dana Middle School, and Correia Middle School.
Ownership History
Date
Name
Owned For
Owner Type
Purchase Details
Closed on
Sep 18, 2013
Sold by
Neptune Properties Ltd Lp
Bought by
Thompson John A
Current Estimated Value
Home Financials for this Owner
Home Financials are based on the most recent Mortgage that was taken out on this home.
Original Mortgage
$960,000
Outstanding Balance
$697,556
Interest Rate
3.75%
Mortgage Type
Adjustable Rate Mortgage/ARM
Estimated Equity
$1,270,913
Purchase Details
Closed on
Aug 31, 2012
Sold by
Elgin Properties Inc
Bought by
Neptune Properties Ltd Lp
Home Financials for this Owner
Home Financials are based on the most recent Mortgage that was taken out on this home.
Original Mortgage
$157,800
Interest Rate
3.49%
Mortgage Type
Seller Take Back
Purchase Details
Closed on
Mar 12, 1997
Sold by
Conyers Robert W and Conyers Faye
Bought by
Elgin Properties Inc
Create a Home Valuation Report for This Property
The Home Valuation Report is an in-depth analysis detailing your home's value as well as a comparison with similar homes in the area
Home Values in the Area
Average Home Value in this Area
Purchase History
| Date | Buyer | Sale Price | Title Company |
|---|---|---|---|
| Thompson John A | $1,200,000 | First American Title Company | |
| Neptune Properties Ltd Lp | $375,000 | Accommodation | |
| Elgin Properties Inc | $500,454 | First American Title Ins Co |
Source: Public Records
Mortgage History
| Date | Status | Borrower | Loan Amount |
|---|---|---|---|
| Open | Thompson John A | $960,000 | |
| Previous Owner | Neptune Properties Ltd Lp | $157,800 |
Source: Public Records
Tax History Compared to Growth
Tax History
| Year | Tax Paid | Tax Assessment Tax Assessment Total Assessment is a certain percentage of the fair market value that is determined by local assessors to be the total taxable value of land and additions on the property. | Land | Improvement |
|---|---|---|---|---|
| 2025 | $17,746 | $1,471,027 | $1,348,446 | $122,581 |
| 2024 | $17,746 | $1,442,184 | $1,322,006 | $120,178 |
| 2023 | $17,355 | $1,413,907 | $1,296,085 | $117,822 |
| 2022 | $16,894 | $1,386,184 | $1,270,672 | $115,512 |
| 2021 | $16,778 | $1,359,005 | $1,245,757 | $113,248 |
| 2020 | $16,575 | $1,345,071 | $1,232,984 | $112,087 |
| 2019 | $16,279 | $1,318,698 | $1,208,808 | $109,890 |
| 2018 | $15,218 | $1,292,842 | $1,185,106 | $107,736 |
| 2017 | $14,857 | $1,267,493 | $1,161,869 | $105,624 |
| 2016 | $14,622 | $1,242,641 | $1,139,088 | $103,553 |
| 2015 | $14,406 | $1,223,976 | $1,121,978 | $101,998 |
| 2014 | $14,178 | $1,200,000 | $1,100,000 | $100,000 |
Source: Public Records
Map
Nearby Homes
- 4848 Bermuda Ave Unit E3
- 1476-80 Pescadero Dr
- 4727 Pescadero Ave
- 4878 Pescadero Ave Unit 403
- 1558 Ebers St
- 4625 Adair St
- 4581 Adair St
- 1171 Sunset Cliffs Blvd
- 4604 Osprey St
- 4768 72 Coronado Ave Ave
- 4985 Coronado Ave Unit 2
- 4867 Santa Cruz Ave
- 4506 Point Loma Ave
- 4515 Tivoli St
- 4569 Coronado Ave
- 4492 Granger St
- 4611 Santa Cruz Ave
- 4617 Del Monte Ave
- 4705-4711 Point Loma Ave Unit 10 & 11
- 1074 Devonshire Dr
- 1415 Ocean Front St
- 4820 Point Loma Ave
- 1421 Ocean Front St
- 1370 Sunset Cliffs Blvd Unit . 3 + Garage 2
- 1370 Sunset Cliffs Blvd
- 1370 1370 Sunset Cliffs Blvd
- 4811 Bermuda Ave
- 4803 Bermuda Ave Unit 1
- 4803 Bermuda Ave
- 4837 Bermuda Ave
- 1440 Sunset Cliffs Blvd
- 4782 Point Loma Ave Unit 88
- 1429 Sunset Cliffs Blvd
- 1429 Sunset Cliffs
- 1433 Sunset Cliffs Blvd
- 1352 1352 Sunset Cliffs Blvd
- 4774 Point Loma Ave Unit 80
- 4775 Bermuda Ave Unit 79
- 4770 Point Loma Ave
- 1454 Sunset Cliffs Blvd