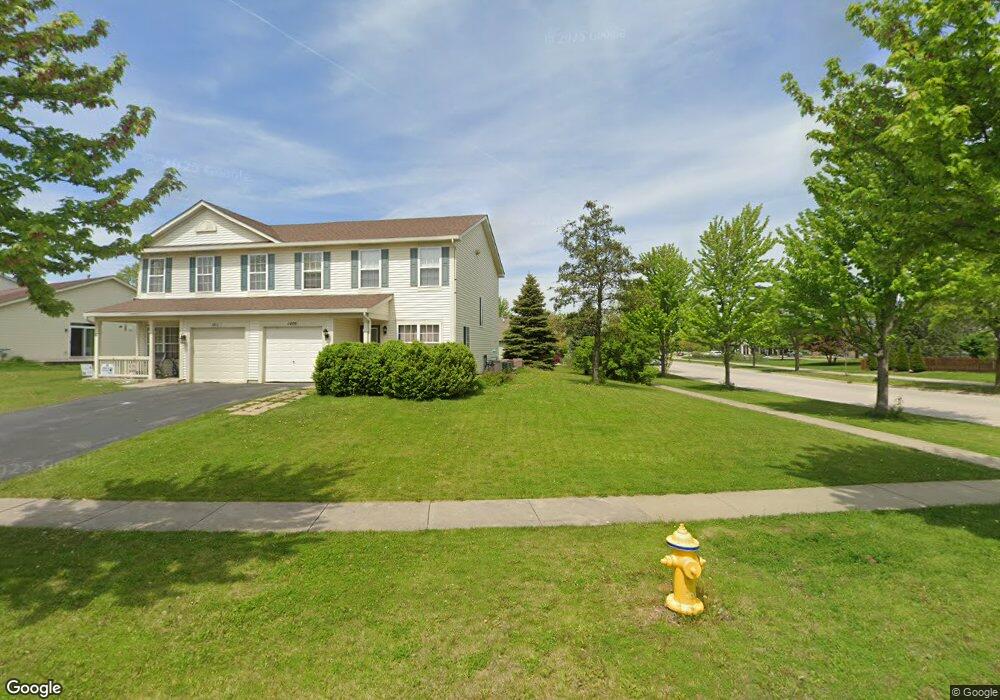
1409 Red Top Ln Minooka, IL 60447
Estimated Value: $238,993 - $263,000
--
Bed
--
Bath
1,446
Sq Ft
$170/Sq Ft
Est. Value
About This Home
This home is located at 1409 Red Top Ln, Minooka, IL 60447 and is currently estimated at $246,248, approximately $170 per square foot. 1409 Red Top Ln is a home located in Grundy County with nearby schools including Minooka Primary Center, Minooka Elementary School, and Minooka Junior High School.
Create a Home Valuation Report for This Property
The Home Valuation Report is an in-depth analysis detailing your home's value as well as a comparison with similar homes in the area
Home Values in the Area
Average Home Value in this Area
Tax History Compared to Growth
Tax History
| Year | Tax Paid | Tax Assessment Tax Assessment Total Assessment is a certain percentage of the fair market value that is determined by local assessors to be the total taxable value of land and additions on the property. | Land | Improvement |
|---|---|---|---|---|
| 2024 | $4,744 | $59,144 | $8,184 | $50,960 |
| 2023 | $4,324 | $53,910 | $7,460 | $46,450 |
| 2022 | $4,021 | $50,125 | $6,936 | $43,189 |
| 2021 | $3,865 | $47,449 | $6,566 | $40,883 |
| 2020 | $3,783 | $45,389 | $6,281 | $39,108 |
| 2019 | $3,594 | $42,027 | $5,816 | $36,211 |
| 2018 | $3,313 | $37,808 | $5,751 | $32,057 |
| 2017 | $3,230 | $36,104 | $5,492 | $30,612 |
| 2016 | $3,035 | $33,891 | $5,155 | $28,736 |
| 2015 | $2,718 | $30,807 | $4,686 | $26,121 |
| 2014 | $2,561 | $30,973 | $5,575 | $25,398 |
| 2013 | $2,628 | $31,390 | $5,650 | $25,740 |
Source: Public Records
Map
Nearby Homes
- 1404 Plantain Dr
- 1468 Sedge Pass
- 1448 Sedge Pass
- 1413 Sedge Pass
- 1420 Marigold Ln
- 324 Wabena Ct
- 25226 S Mallard Dr
- 1935 Waters Edge Dr
- 1941 Waters Edge Dr
- 825 Grant Dr
- 25204 Westwind Dr
- 25441 S Mallard Dr
- 2080 Waters Edge Dr
- 1074-1080 Clover Dr
- 246 Prairie Ridge Dr
- 278,279,280,281 Clover Cir
- Lots 298-301 Clover Cir
- 314 Golden Rod Dr
- 428 E Frontier Dr
- The Rosewood Plan at The Preserve At Heritage Woods - The Preserve at Heritage Woods
- 1411 Red Top Ln
- 1413 Red Top Ln
- 1404 Levato Ln
- 1404 Levato Ln Unit 1404
- 1402 Levato Ln Unit 1
- 1402 Levato Ln
- 1415 Red Top Ln
- 1575 Marigold Ln
- 1406 Levato Ln
- 1417 Red Top Ln
- 1412 Red Top Ln Unit 1412
- 1414 Red Top Ln
- 1416 Red Top Ln
- 1418 Red Top Ln
- 1420 Red Top Ln
- 1422 Red Top Ln
- 1419 Red Top Ln
- 1410 Levato Ln Unit 1
- 1571 Marigold Ln
- 1424 Red Top Ln