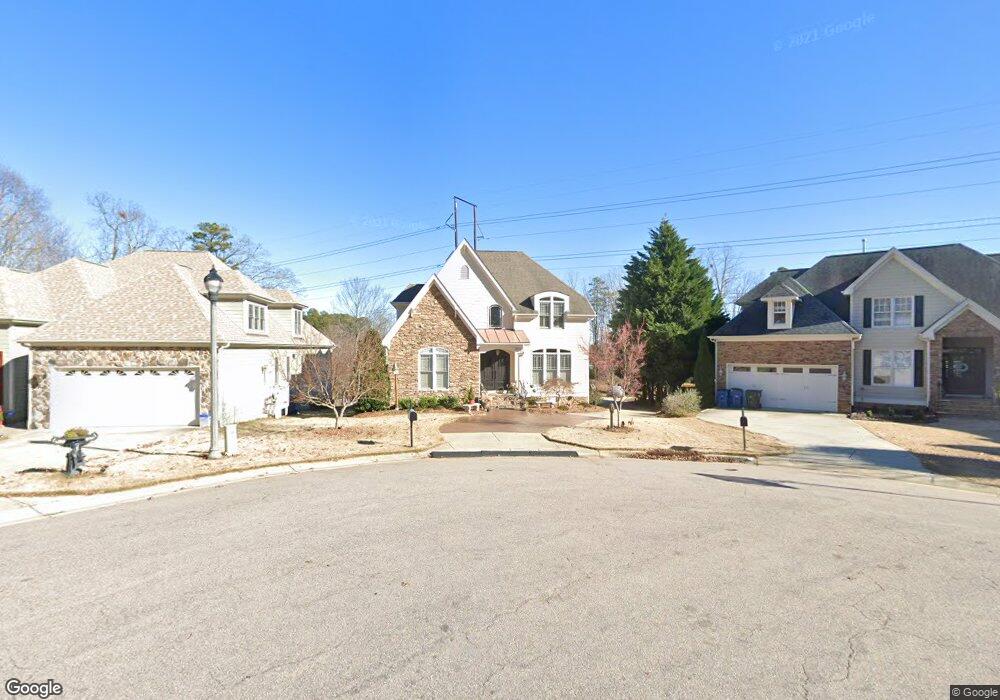
1409 Savannah Oaks Way Raleigh, NC 27614
Estimated Value: $733,385 - $770,000
4
Beds
4
Baths
3,586
Sq Ft
$210/Sq Ft
Est. Value
About This Home
This home is located at 1409 Savannah Oaks Way, Raleigh, NC 27614 and is currently estimated at $754,596, approximately $210 per square foot. 1409 Savannah Oaks Way is a home located in Wake County with nearby schools including Abbotts Creek Elementary School, East Millbrook Middle, and Millbrook High School.
Ownership History
Date
Name
Owned For
Owner Type
Purchase Details
Closed on
Nov 7, 2007
Sold by
Wilmington Finance Inc
Bought by
Bolus Thomas
Current Estimated Value
Purchase Details
Closed on
Aug 9, 2007
Sold by
Black Amber and Black Brandon C
Bought by
Wilmington Finance Inc
Purchase Details
Closed on
Jun 15, 2006
Sold by
Black Amber and Black Brandon C
Bought by
Black Brandon C and Black Amber
Home Financials for this Owner
Home Financials are based on the most recent Mortgage that was taken out on this home.
Original Mortgage
$99,800
Interest Rate
6.17%
Mortgage Type
Stand Alone Second
Purchase Details
Closed on
Jan 21, 2005
Sold by
Tuscany Construction Group Inc
Bought by
Manthey Amber
Home Financials for this Owner
Home Financials are based on the most recent Mortgage that was taken out on this home.
Original Mortgage
$330,000
Interest Rate
1%
Mortgage Type
Fannie Mae Freddie Mac
Create a Home Valuation Report for This Property
The Home Valuation Report is an in-depth analysis detailing your home's value as well as a comparison with similar homes in the area
Home Values in the Area
Average Home Value in this Area
Purchase History
| Date | Buyer | Sale Price | Title Company |
|---|---|---|---|
| Bolus Thomas | $389,000 | None Available | |
| Wilmington Finance Inc | $415,650 | None Available | |
| Black Brandon C | -- | None Available | |
| Manthey Amber | $412,500 | -- |
Source: Public Records
Mortgage History
| Date | Status | Borrower | Loan Amount |
|---|---|---|---|
| Previous Owner | Black Brandon C | $99,800 | |
| Previous Owner | Black Brandon C | $399,200 | |
| Previous Owner | Manthey Amber | $330,000 |
Source: Public Records
Tax History Compared to Growth
Tax History
| Year | Tax Paid | Tax Assessment Tax Assessment Total Assessment is a certain percentage of the fair market value that is determined by local assessors to be the total taxable value of land and additions on the property. | Land | Improvement |
|---|---|---|---|---|
| 2025 | $5,676 | $648,594 | $112,500 | $536,094 |
| 2024 | $5,653 | $648,594 | $112,500 | $536,094 |
| 2023 | $5,430 | $496,332 | $106,250 | $390,082 |
| 2022 | $5,045 | $496,332 | $106,250 | $390,082 |
| 2021 | $4,849 | $496,332 | $106,250 | $390,082 |
| 2020 | $4,761 | $496,332 | $106,250 | $390,082 |
| 2019 | $5,126 | $440,559 | $86,250 | $354,309 |
| 2018 | $4,834 | $440,559 | $86,250 | $354,309 |
| 2017 | $4,603 | $440,559 | $86,250 | $354,309 |
| 2016 | $4,508 | $508,605 | $86,250 | $422,355 |
| 2015 | $4,621 | $447,902 | $70,000 | $377,902 |
| 2014 | $4,418 | $447,902 | $70,000 | $377,902 |
Source: Public Records
Map
Nearby Homes
- 11035 Southwalk Ln
- 1301 Durlain Dr Unit 103
- 11020 Southwalk Ln
- 1310 Durlain Dr Unit 103
- 10506 Pleasant Branch Dr Unit Lot 38
- 11001 Louson Place
- 10520 Pleasant Branch Dr Unit Lot 32
- 1404 Mitford Woods Ct
- 10534 Pleasant Branch Dr Unit Lot 30
- 10531 Pleasant Branch Dr Unit 201
- 10542 Pleasant Branch Dr Unit Lot 27
- 10546 Pleasant Branch Dr Unit Lot 25
- 10548 Pleasant Branch Dr Unit Lot 24
- 10547 Pleasant Branch Dr Unit 201
- 10552 Pleasant Branch Dr Unit Lot 23
- 10549 Pleasant Branch Dr Unit 201
- 10549 Pleasant Branch Dr Unit 101
- 10554 Pleasant Branch Dr Unit Lot 22
- 10556 Pleasant Branch Dr Unit Lot 21
- 10558 Pleasant Branch Dr Unit Lot 20
- 1405 Savannah Oaks Way
- 1413 Savannah Oaks Way
- 10204 Rocky Ford Ct
- 1412 Savannah Oaks Way
- 10208 Rocky Ford Ct
- 10200 Rocky Ford Ct
- 1408 Savannah Oaks Way
- 1404 Savannah Oaks Way
- 11200 Oak Stone Ct
- 10212 Rocky Ford Ct
- 11204 Oak Stone Ct Unit Lot 06
- 10201 Rocky Ford Ct
- 10300 Rocky Ford Ct
- 11208 Oak Stone Ct Unit Lot 05
- 10205 Rocky Ford Ct
- 10209 Rocky Ford Ct
- 11138 Raven Ridge Rd
- 11138 Raven Ridge Rd Unit 1A
- 11124 Raven Ridge Rd
- 10304 Rocky Ford Ct