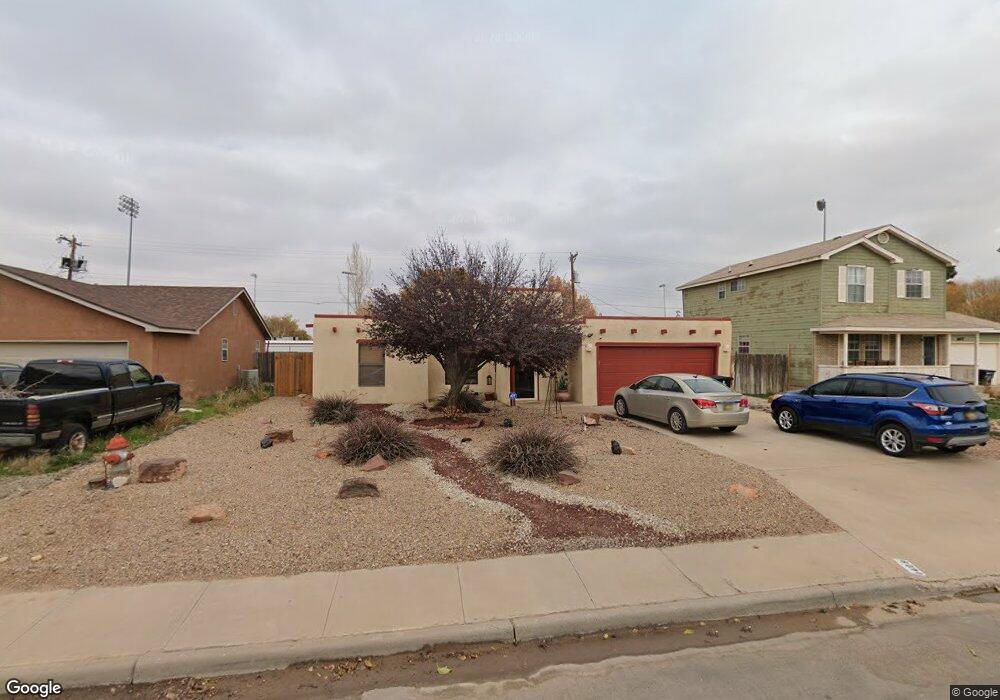
1409 Sunset Place Roswell, NM 88203
Estimated Value: $195,000 - $249,539
3
Beds
2
Baths
1,379
Sq Ft
$160/Sq Ft
Est. Value
About This Home
This home is located at 1409 Sunset Place, Roswell, NM 88203 and is currently estimated at $220,635, approximately $159 per square foot. 1409 Sunset Place is a home located in Chaves County with nearby schools including Monterrey Elementary School, Mountain View Middle School, and Roswell High School.
Ownership History
Date
Name
Owned For
Owner Type
Purchase Details
Closed on
Jul 1, 2016
Sold by
First American Bank
Bought by
The Reba Savoie Irrevocable Trust
Current Estimated Value
Purchase Details
Closed on
Feb 28, 2007
Sold by
Alexis Issac and Alexis Darla
Bought by
Savoie Reba L
Home Financials for this Owner
Home Financials are based on the most recent Mortgage that was taken out on this home.
Original Mortgage
$100,000
Interest Rate
6.21%
Mortgage Type
New Conventional
Purchase Details
Closed on
Sep 12, 2006
Sold by
Oden William N
Bought by
Alexis Isaac and Alexis Darla
Home Financials for this Owner
Home Financials are based on the most recent Mortgage that was taken out on this home.
Original Mortgage
$114,950
Interest Rate
6.64%
Mortgage Type
New Conventional
Create a Home Valuation Report for This Property
The Home Valuation Report is an in-depth analysis detailing your home's value as well as a comparison with similar homes in the area
Home Values in the Area
Average Home Value in this Area
Purchase History
| Date | Buyer | Sale Price | Title Company |
|---|---|---|---|
| The Reba Savoie Irrevocable Trust | -- | None Available | |
| Savoie Reba L | -- | Landmark Title | |
| Alexis Isaac | -- | Landamerica Lawyers Title Of | |
| Oden William N | -- | Landamerica Lawyers Title Of |
Source: Public Records
Mortgage History
| Date | Status | Borrower | Loan Amount |
|---|---|---|---|
| Previous Owner | Savoie Reba L | $100,000 | |
| Previous Owner | Oden William N | $114,950 |
Source: Public Records
Tax History Compared to Growth
Tax History
| Year | Tax Paid | Tax Assessment Tax Assessment Total Assessment is a certain percentage of the fair market value that is determined by local assessors to be the total taxable value of land and additions on the property. | Land | Improvement |
|---|---|---|---|---|
| 2025 | $1,432 | $54,244 | $3,333 | $50,911 |
| 2024 | $1,432 | $52,664 | $3,333 | $49,331 |
| 2023 | $1,435 | $51,130 | $3,333 | $47,797 |
| 2022 | $1,380 | $49,641 | $3,333 | $46,308 |
| 2021 | $1,370 | $48,196 | $3,333 | $44,863 |
| 2020 | $1,330 | $46,792 | $3,333 | $43,459 |
| 2019 | $1,298 | $45,746 | $3,107 | $42,639 |
| 2018 | $1,258 | $44,414 | $2,909 | $41,505 |
| 2017 | $1,211 | $43,120 | $2,333 | $40,787 |
| 2016 | $1,262 | $45,415 | $2,333 | $43,082 |
| 2015 | $1,348 | $44,092 | $2,333 | $41,759 |
| 2014 | $2,618 | $42,808 | $2,333 | $40,475 |
Source: Public Records
Map
Nearby Homes
- 1505 Taylor Dr
- 3003 S Louisiana Ave
- 1406 Yale Dr
- 1202 Baylor Dr
- 1034 Ivy Dr
- 1000 Fern Dr
- 1009 Ivy Dr
- 704 W Gayle St
- 702 Hickory Dr
- 609 W Gayle St
- 1012 S Plains Park Dr
- 600 Barnett Dr
- 608 Hickory Dr
- 305 S Sunset Ave
- 2904 S Lea Ave
- 503 W Hervey Dr
- 1907 S Washington Ave
- 00 Blanco Rosa Ln
- Buena Vida Block: 35 Lot: 1 Bk: 400
- 2800 W Onyx St
- 1407 Sunset Place
- 1501 Sunset Place
- 1408 Sunset Place
- 1406 Sunset Place
- 1404 Sunset Place
- 1500 Sunset Place
- 1403 Sunset Place
- 1505 Sunset Place
- 1507 Sunset Place
- 1502 Sunset Place
- 1504 Sunset Place
- 1402 Sunset Place
- 1401 Sunset Place
- 1506 Sunset Place
- 1400 Sunset Place
- 1409 Taylor Dr
- 1407 Taylor Dr
- 1501 Taylor Dr
- 1307 Sunset Place