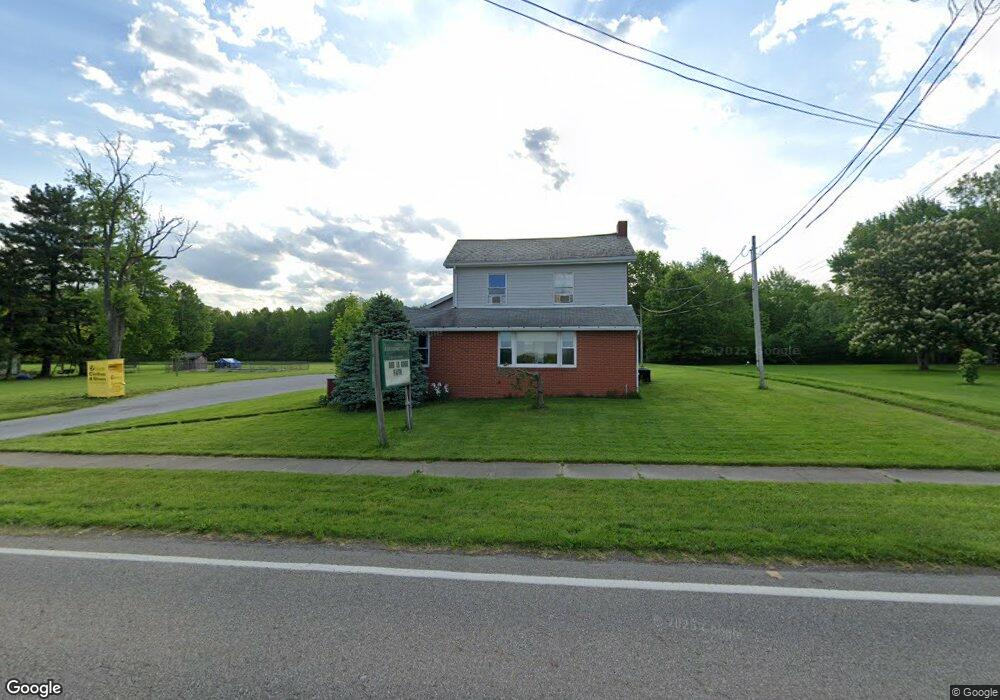
14091 S Main St Beloit, OH 44609
Estimated Value: $132,000 - $154,000
3
Beds
1
Bath
1,812
Sq Ft
$78/Sq Ft
Est. Value
About This Home
This home is located at 14091 S Main St, Beloit, OH 44609 and is currently estimated at $140,921, approximately $77 per square foot. 14091 S Main St is a home located in Mahoning County with nearby schools including West Branch Middle School, West Branch Early Learning Center, and West Branch High School.
Ownership History
Date
Name
Owned For
Owner Type
Purchase Details
Closed on
Sep 11, 2020
Bought by
Mcdaniel Serene Kae
Current Estimated Value
Purchase Details
Closed on
Jan 31, 2014
Sold by
Mcdaniel Todd
Bought by
Mcdaniel Serene Kae
Purchase Details
Closed on
Mar 28, 2007
Sold by
Mcdaniel Serene Kae and Mcdaniel Todd
Bought by
Mcdaniel Todd and Mcdaniel Serene Kae
Purchase Details
Closed on
Sep 27, 2005
Sold by
Knepper Robert and Knepper Patricia A
Bought by
Mcdaniel Serene Kae and Wilton Wendi Gail
Purchase Details
Closed on
Oct 14, 1999
Sold by
Estes Ricky D and Estes Beverly L
Bought by
Jarvis Aaron W and Jarvis Nicole L
Home Financials for this Owner
Home Financials are based on the most recent Mortgage that was taken out on this home.
Original Mortgage
$93,375
Interest Rate
7.9%
Mortgage Type
Purchase Money Mortgage
Create a Home Valuation Report for This Property
The Home Valuation Report is an in-depth analysis detailing your home's value as well as a comparison with similar homes in the area
Purchase History
| Date | Buyer | Sale Price | Title Company |
|---|---|---|---|
| Mcdaniel Serene Kae | -- | -- | |
| Mcdaniel Serene Kae | -- | Attorney | |
| Mcdaniel Todd | $30,200 | Attorney | |
| Mcdaniel Serene Kae | $90,000 | -- | |
| Jarvis Aaron W | $92,700 | -- |
Source: Public Records
Mortgage History
| Date | Status | Borrower | Loan Amount |
|---|---|---|---|
| Previous Owner | Jarvis Aaron W | $93,375 |
Source: Public Records
Tax History
| Year | Tax Paid | Tax Assessment Tax Assessment Total Assessment is a certain percentage of the fair market value that is determined by local assessors to be the total taxable value of land and additions on the property. | Land | Improvement |
|---|---|---|---|---|
| 2025 | $1,647 | $31,660 | $3,470 | $28,190 |
| 2024 | $1,651 | $31,660 | $3,470 | $28,190 |
| 2023 | $1,638 | $31,660 | $3,470 | $28,190 |
| 2022 | $1,210 | $20,470 | $2,840 | $17,630 |
| 2021 | $1,344 | $20,470 | $2,840 | $17,630 |
| 2020 | $1,507 | $22,870 | $5,240 | $17,630 |
| 2019 | $1,511 | $22,870 | $5,240 | $17,630 |
| 2018 | $1,521 | $22,870 | $5,240 | $17,630 |
| 2017 | $1,493 | $22,870 | $5,240 | $17,630 |
| 2016 | $1,281 | $22,350 | $4,880 | $17,470 |
| 2015 | $1,253 | $22,350 | $4,880 | $17,470 |
| 2014 | -- | $22,350 | $4,880 | $17,470 |
| 2013 | $1,244 | $22,350 | $4,880 | $17,470 |
Source: Public Records
Map
Nearby Homes
- 18061 Derr Ave
- 17325 5th St
- 11 Redwood St
- 18 Boxwood Dr
- 57 Redwood St
- 73 Redwood St
- 27443 State Route 62
- 17394 State Route 62
- 455 E Ohio Ave
- 18262 W Pine Lake Rd
- 345 E Indiana Ave
- 726 N 12th St
- 408 North St
- 324 S 15th St
- 157 E Ohio Ave
- 26223 Wildwood Dr
- 35 Bayview Dr
- 1005 N 13th St
- 325 W Maryland Ave
- 14831 Smith Goshen Rd
- 14129 S Main St
- 14059 S Main St
- 14145 S Main St
- 14064 S Main St
- 14047 S Main St
- 14159 S Main St
- 14150 S Main St
- 14035 S Main St
- 14177 S Main St
- 14023 S Main St
- 14160 S Main St
- 14009 S Main St
- 14192 S Main St
- 14206 S Main St
- 13981 S Main St
- 14220 S Main St
- 13969 S Main St
- 13971 Oak Ave
- 14242 S Main St
- 13958 Oak Ave
Your Personal Tour Guide
Ask me questions while you tour the home.