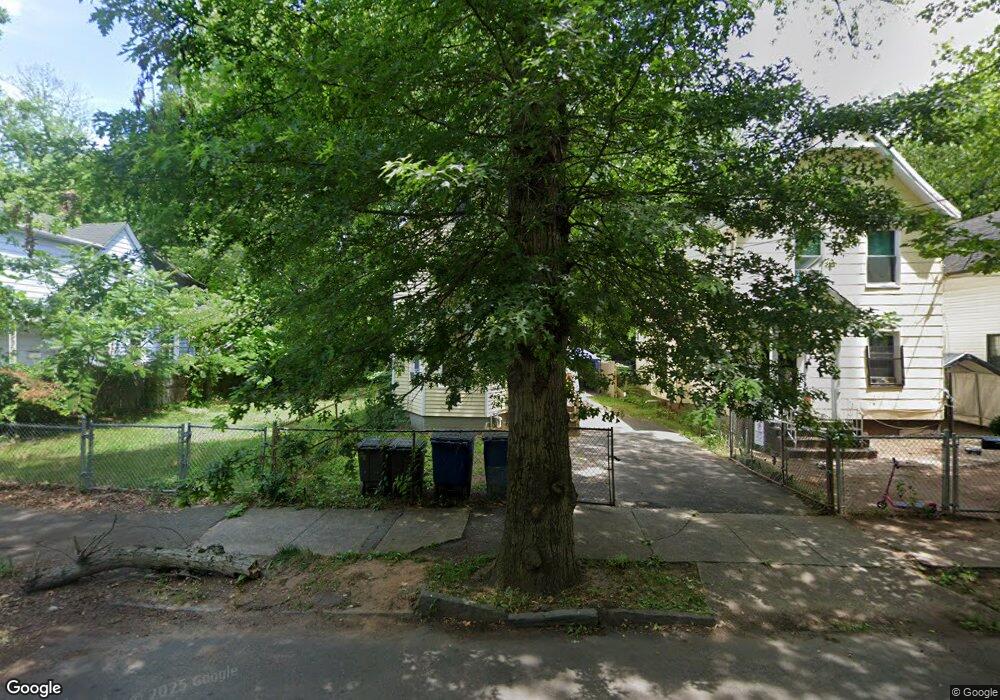
141 Butler St New Haven, CT 06511
Newhallville NeighborhoodEstimated Value: $201,000 - $312,000
4
Beds
2
Baths
1,094
Sq Ft
$235/Sq Ft
Est. Value
About This Home
This home is located at 141 Butler St, New Haven, CT 06511 and is currently estimated at $256,794, approximately $234 per square foot. 141 Butler St is a home located in New Haven County with nearby schools including Highville Charter School, The Foote School, and Cedarhurst School.
Ownership History
Date
Name
Owned For
Owner Type
Purchase Details
Closed on
Sep 19, 2014
Sold by
Sun Escape Llc
Bought by
Happy Days Holdings Ll
Current Estimated Value
Home Financials for this Owner
Home Financials are based on the most recent Mortgage that was taken out on this home.
Original Mortgage
$1,700,000
Interest Rate
4.14%
Purchase Details
Closed on
Oct 21, 2011
Sold by
555 Winchester Avenue
Bought by
Sun Escape Llc
Purchase Details
Closed on
Sep 16, 2011
Sold by
Ez Mortgage Llc
Bought by
555 Winchester Ave Llc
Purchase Details
Closed on
Nov 25, 2009
Sold by
Constitution Holding L
Bought by
Ez Mortgage Llc
Purchase Details
Closed on
Jan 29, 2008
Sold by
Novastar Mortgage Inc
Bought by
Constitution Holding L
Purchase Details
Closed on
Jun 1, 2005
Sold by
Walsh Bennie M
Bought by
Gore Joseph
Purchase Details
Closed on
Jan 2, 1996
Sold by
Fnma
Bought by
Walsh William
Create a Home Valuation Report for This Property
The Home Valuation Report is an in-depth analysis detailing your home's value as well as a comparison with similar homes in the area
Home Values in the Area
Average Home Value in this Area
Purchase History
| Date | Buyer | Sale Price | Title Company |
|---|---|---|---|
| Happy Days Holdings Ll | -- | -- | |
| Sun Escape Llc | $75,000 | -- | |
| 555 Winchester Ave Llc | -- | -- | |
| Ez Mortgage Llc | -- | -- | |
| Constitution Holding L | $59,000 | -- | |
| Gore Joseph | $101,000 | -- | |
| Walsh William | $10,500 | -- |
Source: Public Records
Mortgage History
| Date | Status | Borrower | Loan Amount |
|---|---|---|---|
| Closed | Walsh William | $1,700,000 | |
| Previous Owner | Walsh William | $75,000 |
Source: Public Records
Tax History Compared to Growth
Tax History
| Year | Tax Paid | Tax Assessment Tax Assessment Total Assessment is a certain percentage of the fair market value that is determined by local assessors to be the total taxable value of land and additions on the property. | Land | Improvement |
|---|---|---|---|---|
| 2025 | $4,063 | $103,110 | $31,920 | $71,190 |
| 2024 | $3,970 | $103,110 | $31,920 | $71,190 |
| 2023 | $3,836 | $103,110 | $31,920 | $71,190 |
| 2022 | $4,099 | $103,110 | $31,920 | $71,190 |
| 2021 | $2,884 | $65,730 | $25,550 | $40,180 |
| 2020 | $2,884 | $65,730 | $25,550 | $40,180 |
| 2019 | $2,825 | $65,730 | $25,550 | $40,180 |
| 2018 | $2,825 | $65,730 | $25,550 | $40,180 |
| 2017 | $2,542 | $65,730 | $25,550 | $40,180 |
| 2016 | $2,100 | $50,540 | $11,340 | $39,200 |
| 2015 | $2,100 | $50,540 | $11,340 | $39,200 |
| 2014 | $2,100 | $50,540 | $11,340 | $39,200 |
Source: Public Records
Map
Nearby Homes
- 139 Butler St
- 153 Butler St
- 137 Butler St
- 155 Butler St
- 135 Butler St
- 187 Butler St
- 159 Butler St
- 82 Shepard St
- 80 Shepard St Unit 2
- 80 Shepard St Unit 1
- 86 Shepard St
- 76 Shepard St
- 161 Butler St
- 74 Shepard St
- 175 Butler St
- 72 Shepard St
- 142 Butler St
- 142 Butler St Unit 2nd fl
- 146 Butler St
- 138 Butler St