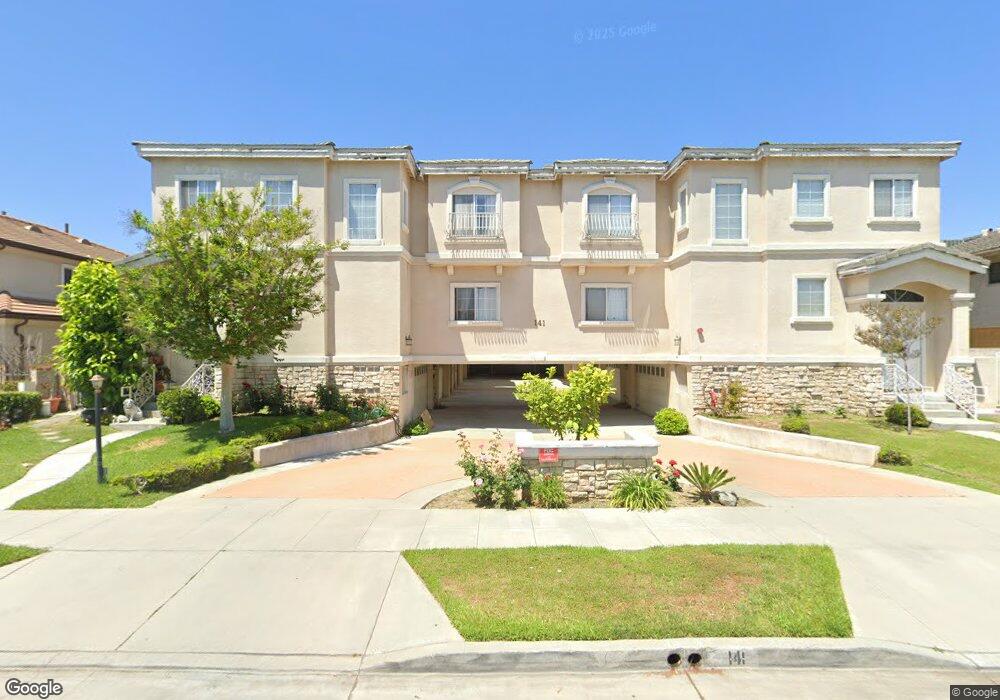
141 California St Unit G Arcadia, CA 91006
Estimated Value: $1,049,632 - $1,227,000
3
Beds
3
Baths
1,860
Sq Ft
$615/Sq Ft
Est. Value
About This Home
This home is located at 141 California St Unit G, Arcadia, CA 91006 and is currently estimated at $1,144,658, approximately $615 per square foot. 141 California St Unit G is a home located in Los Angeles County with nearby schools including Holly Avenue Elementary School, First Avenue Middle School, and Arcadia High School.
Ownership History
Date
Name
Owned For
Owner Type
Purchase Details
Closed on
Nov 26, 2014
Sold by
Bhawal Biplab
Bought by
Biplab Rumi Living Trust
Current Estimated Value
Purchase Details
Closed on
Mar 10, 2002
Sold by
Rinkin Dana D
Bought by
Bhawal Biplab
Home Financials for this Owner
Home Financials are based on the most recent Mortgage that was taken out on this home.
Original Mortgage
$300,000
Outstanding Balance
$122,847
Interest Rate
6.78%
Estimated Equity
$1,021,811
Purchase Details
Closed on
Oct 29, 2001
Sold by
Uptown Development Llc
Bought by
Rinkin Dana D
Home Financials for this Owner
Home Financials are based on the most recent Mortgage that was taken out on this home.
Original Mortgage
$315,000
Interest Rate
7.99%
Create a Home Valuation Report for This Property
The Home Valuation Report is an in-depth analysis detailing your home's value as well as a comparison with similar homes in the area
Home Values in the Area
Average Home Value in this Area
Purchase History
| Date | Buyer | Sale Price | Title Company |
|---|---|---|---|
| Biplab Rumi Living Trust | -- | None Available | |
| Bhawal Biplab | $378,000 | Equity Title | |
| Rinkin Dana D | $350,000 | Fidelity National Title Co |
Source: Public Records
Mortgage History
| Date | Status | Borrower | Loan Amount |
|---|---|---|---|
| Open | Bhawal Biplab | $300,000 | |
| Previous Owner | Rinkin Dana D | $315,000 | |
| Closed | Bhawal Biplab | $59,000 |
Source: Public Records
Tax History Compared to Growth
Tax History
| Year | Tax Paid | Tax Assessment Tax Assessment Total Assessment is a certain percentage of the fair market value that is determined by local assessors to be the total taxable value of land and additions on the property. | Land | Improvement |
|---|---|---|---|---|
| 2025 | $6,516 | $558,401 | $291,610 | $266,791 |
| 2024 | $6,516 | $547,453 | $285,893 | $261,560 |
| 2023 | $6,383 | $536,720 | $280,288 | $256,432 |
| 2022 | $6,177 | $526,197 | $274,793 | $251,404 |
| 2021 | $6,060 | $515,880 | $269,405 | $246,475 |
| 2019 | $5,916 | $500,580 | $261,415 | $239,165 |
| 2018 | $5,770 | $490,766 | $256,290 | $234,476 |
| 2016 | $5,594 | $471,711 | $246,339 | $225,372 |
| 2015 | $5,498 | $464,626 | $242,639 | $221,987 |
| 2014 | $5,425 | $455,526 | $237,887 | $217,639 |
Source: Public Records
Map
Nearby Homes
- 133 California St Unit 6
- 148 California St
- 125 California St Unit C
- 135 Diamond St
- 125 Diamond St Unit H
- 306 S 1st Ave Unit 105
- 227 California St Unit A
- 148 Diamond St Unit C
- 154 Diamond St Unit B
- 53 California St
- 586 S 2nd Ave Unit B
- 415 California St Unit D
- 31 Alta St Unit A
- 417 California St Unit F
- 215 S 5th Ave Unit A
- 25 Fano St
- 4312 Jasmine Ln
- 325 E Duarte Rd Unit C
- 419 E Duarte Rd Unit D
- 56 E Duarte Rd Unit 406
- 141 California St Unit A
- 141 California St Unit E
- 141 California St Unit H
- 141 California St Unit D
- 141 California St Unit C
- 141 California St Unit F
- 141 California St Unit B
- 147 California St
- 137 California St
- 155 California St
- 133 California St
- 133 California St Unit 8
- 133 California St Unit 7
- 133 California St Unit 5
- 129 California St Unit 4
- 129 California St Unit 3
- 129 California St Unit 1
- 160 California St
- 144 Bonita St
- 148 Bonita St