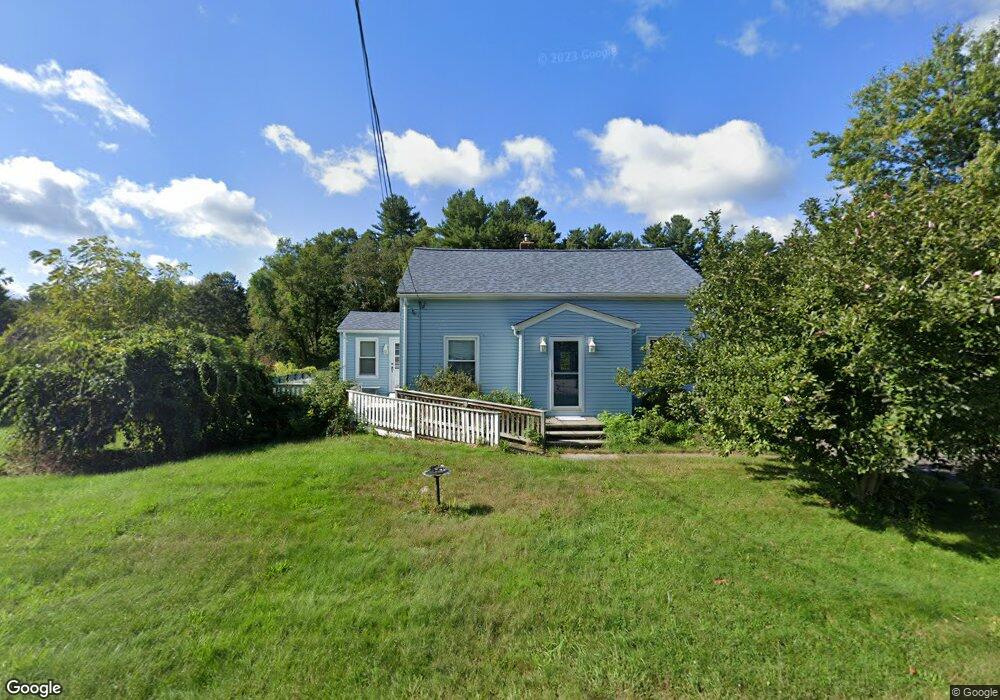
141 Charlton St Oxford, MA 01540
Estimated Value: $409,000 - $443,154
2
Beds
1
Bath
1,491
Sq Ft
$282/Sq Ft
Est. Value
About This Home
This home is located at 141 Charlton St, Oxford, MA 01540 and is currently estimated at $420,539, approximately $282 per square foot. 141 Charlton St is a home located in Worcester County with nearby schools including Alfred M Chaffee, Oxford High School, and Clara Barton Elementary School.
Ownership History
Date
Name
Owned For
Owner Type
Purchase Details
Closed on
Apr 3, 2021
Sold by
Higgins Sara-Jean and Higgins David
Bought by
Connery Gloria J
Current Estimated Value
Home Financials for this Owner
Home Financials are based on the most recent Mortgage that was taken out on this home.
Original Mortgage
$104,000
Outstanding Balance
$93,569
Interest Rate
3.05%
Mortgage Type
New Conventional
Estimated Equity
$326,970
Purchase Details
Closed on
Oct 4, 2000
Sold by
Dube Roland J and Dube Linda M
Bought by
Connery Gloria J
Home Financials for this Owner
Home Financials are based on the most recent Mortgage that was taken out on this home.
Original Mortgage
$104,800
Interest Rate
7.96%
Mortgage Type
Purchase Money Mortgage
Create a Home Valuation Report for This Property
The Home Valuation Report is an in-depth analysis detailing your home's value as well as a comparison with similar homes in the area
Home Values in the Area
Average Home Value in this Area
Purchase History
| Date | Buyer | Sale Price | Title Company |
|---|---|---|---|
| Connery Gloria J | -- | None Available | |
| Connery Gloria J | $131,000 | -- |
Source: Public Records
Mortgage History
| Date | Status | Borrower | Loan Amount |
|---|---|---|---|
| Open | Connery Gloria J | $104,000 | |
| Previous Owner | Connery Gloria J | $104,800 | |
| Previous Owner | Connery Gloria J | $80,000 |
Source: Public Records
Tax History Compared to Growth
Tax History
| Year | Tax Paid | Tax Assessment Tax Assessment Total Assessment is a certain percentage of the fair market value that is determined by local assessors to be the total taxable value of land and additions on the property. | Land | Improvement |
|---|---|---|---|---|
| 2025 | $46 | $366,600 | $119,700 | $246,900 |
| 2024 | $4,680 | $347,200 | $110,500 | $236,700 |
| 2023 | $4,317 | $316,500 | $98,700 | $217,800 |
| 2022 | $3,576 | $221,300 | $71,900 | $149,400 |
| 2021 | $3,425 | $207,200 | $68,300 | $138,900 |
| 2020 | $3,292 | $197,600 | $68,300 | $129,300 |
| 2019 | $2,994 | $175,800 | $68,300 | $107,500 |
| 2018 | $3,036 | $175,800 | $68,300 | $107,500 |
| 2017 | $3,038 | $180,300 | $68,300 | $112,000 |
| 2016 | $3,052 | $180,300 | $68,300 | $112,000 |
| 2015 | $2,847 | $180,300 | $68,300 | $112,000 |
| 2014 | $2,793 | $186,200 | $68,300 | $117,900 |
Source: Public Records
Map
Nearby Homes
- 143 Charlton St
- 139 Charlton St
- 142 Charlton St Unit F
- 142 Charlton St Unit E
- 142 Charlton St Unit D
- 142 Charlton St Unit C
- 142 Charlton St Unit B
- 142 Charlton St Unit A
- 144 Charlton St
- 145 Charlton St
- 137 Charlton St
- 8 Theresa Cir
- 138 Charlton St
- 7 Theresa Cir
- 1 Fox Run Dr
- 146 Charlton St
- 147 Charlton St
- 3 Fox Run Dr
- 6 Theresa Cir
- 9 Theresa Cir