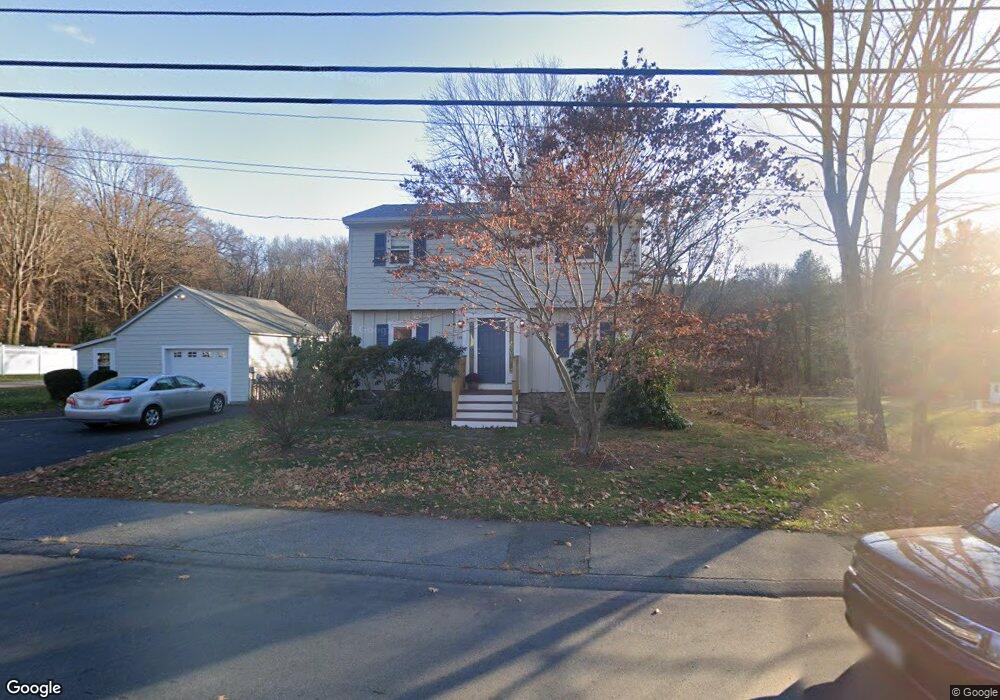
141 Chestnut St Andover, MA 01810
East Andover NeighborhoodEstimated Value: $1,140,000 - $1,329,000
About This Home
This home is located at 141 Chestnut St, Andover, MA 01810 and is currently estimated at $1,214,808, approximately $371 per square foot. 141 Chestnut St is a home located in Essex County with nearby schools including Bancroft Elementary School, Doherty Middle School, and Andover High School.
Ownership History
We collect this data history from publicly available records. To have your information removed, we recommend requesting removal directly through your county’s website.
Purchase Details
Purchase Details
Purchase Details
Home Values in the Area
Average Home Value in this Area
Purchase History
We collect this data history from publicly available records. To have your information removed, we recommend requesting removal directly through your county’s website.
| Date | Buyer | Sale Price | Title Company |
|---|---|---|---|
| -- | -- | ||
| -- | -- | ||
| $234,900 | -- | ||
| $234,900 | -- | ||
| $165,000 | -- | ||
| $165,000 | -- |
Mortgage History
We collect this data history from publicly available records. To have your information removed, we recommend requesting removal directly through your county’s website.
| Date | Status | Borrower | Loan Amount |
|---|---|---|---|
| Previous Owner | $54,000 | ||
| Previous Owner | $184,000 |
Tax History
We collect this data history from publicly available records. To have your information removed, we recommend requesting removal directly through your county’s website.
| Year | Tax Paid | Tax Assessment Tax Assessment Total Assessment is a certain percentage of the fair market value that is determined by local assessors to be the total taxable value of land and additions on the property. | Land | Improvement |
|---|---|---|---|---|
| 2025 | $12,047 | $964,500 | $541,600 | $422,900 |
| 2024 | $11,486 | $891,800 | $496,200 | $395,600 |
| 2023 | $11,149 | $816,200 | $447,100 | $369,100 |
| 2022 | $10,268 | $703,300 | $395,900 | $307,400 |
| 2021 | $9,862 | $645,000 | $360,000 | $285,000 |
| 2020 | $9,492 | $632,400 | $351,300 | $281,100 |
| 2019 | $9,368 | $613,500 | $337,700 | $275,800 |
| 2018 | $8,988 | $574,700 | $318,600 | $256,100 |
| 2017 | $8,621 | $567,900 | $312,300 | $255,600 |
| 2016 | $8,444 | $569,800 | $312,300 | $257,500 |
| 2015 | -- | $545,500 | $300,500 | $245,000 |
Map
- 145 Chestnut St
- 143 Chestnut St
- 147 Chestnut St
- 149 Chestnut St
- 139 Chestnut St
- 136 Chestnut St
- 135 Chestnut St
- 134 Chestnut St
- 140 Chestnut St
- 151 Chestnut St
- 4 Sherry Dr
- 144 Chestnut St
- 22 Upland Rd
- 129 Chestnut St
- 6 Sherry Dr
- 124 Chestnut St
- 124 Chestnut St Unit 1
- 122 Chestnut St
- 5 Sherry Dr
- 155 Chestnut St
Ask me questions while you tour the home.