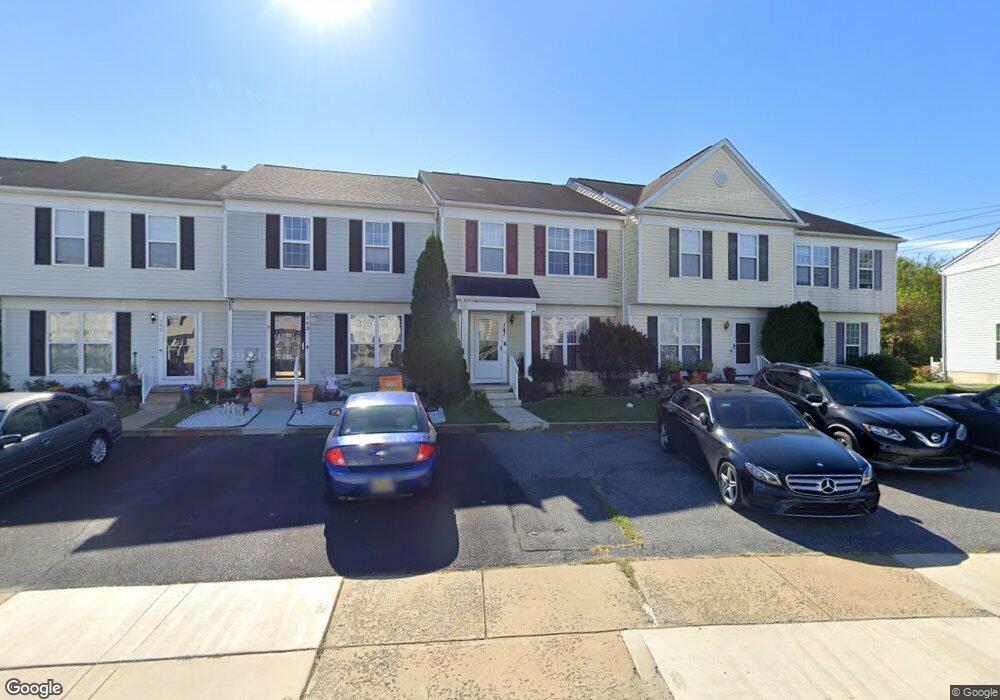
141 Darling St Newark, DE 19702
Estimated Value: $303,000 - $331,000
3
Beds
3
Baths
1,320
Sq Ft
$240/Sq Ft
Est. Value
About This Home
This home is located at 141 Darling St, Newark, DE 19702 and is currently estimated at $316,677, approximately $239 per square foot. 141 Darling St is a home located in New Castle County with nearby schools including Marshall (Thurgood) Elementary School, Christiana High School, and Kirk (George V.) Middle School.
Ownership History
Date
Name
Owned For
Owner Type
Purchase Details
Closed on
Oct 14, 2005
Sold by
Queen Norvell J and Queen Monica P
Bought by
Moran Leigh Anna
Current Estimated Value
Home Financials for this Owner
Home Financials are based on the most recent Mortgage that was taken out on this home.
Original Mortgage
$166,400
Outstanding Balance
$89,177
Interest Rate
5.78%
Mortgage Type
Fannie Mae Freddie Mac
Estimated Equity
$227,500
Purchase Details
Closed on
Jun 28, 2001
Sold by
Pulte Home Corp
Bought by
Queen Norvell J and Queen Monica P
Home Financials for this Owner
Home Financials are based on the most recent Mortgage that was taken out on this home.
Original Mortgage
$130,031
Interest Rate
7.2%
Mortgage Type
FHA
Purchase Details
Closed on
Feb 16, 2001
Sold by
River Walk Inc
Bought by
Pulte Home Corp
Create a Home Valuation Report for This Property
The Home Valuation Report is an in-depth analysis detailing your home's value as well as a comparison with similar homes in the area
Home Values in the Area
Average Home Value in this Area
Purchase History
| Date | Buyer | Sale Price | Title Company |
|---|---|---|---|
| Moran Leigh Anna | $208,000 | -- | |
| Queen Norvell J | $131,065 | Stewart Title Guaranty Compa | |
| Pulte Home Corp | $251,250 | -- |
Source: Public Records
Mortgage History
| Date | Status | Borrower | Loan Amount |
|---|---|---|---|
| Open | Moran Leigh Anna | $166,400 | |
| Previous Owner | Queen Norvell J | $130,031 |
Source: Public Records
Tax History Compared to Growth
Tax History
| Year | Tax Paid | Tax Assessment Tax Assessment Total Assessment is a certain percentage of the fair market value that is determined by local assessors to be the total taxable value of land and additions on the property. | Land | Improvement |
|---|---|---|---|---|
| 2024 | $2,470 | $56,200 | $8,100 | $48,100 |
| 2023 | $2,405 | $56,200 | $8,100 | $48,100 |
| 2022 | $2,388 | $56,200 | $8,100 | $48,100 |
| 2021 | $2,337 | $56,200 | $8,100 | $48,100 |
| 2020 | $2,273 | $56,200 | $8,100 | $48,100 |
| 2019 | $2,273 | $56,200 | $8,100 | $48,100 |
| 2018 | $1,971 | $56,200 | $8,100 | $48,100 |
| 2017 | $1,903 | $56,200 | $8,100 | $48,100 |
| 2016 | $1,888 | $56,200 | $8,100 | $48,100 |
| 2015 | $1,727 | $56,200 | $8,100 | $48,100 |
| 2014 | $1,728 | $56,200 | $8,100 | $48,100 |
Source: Public Records
Map
Nearby Homes