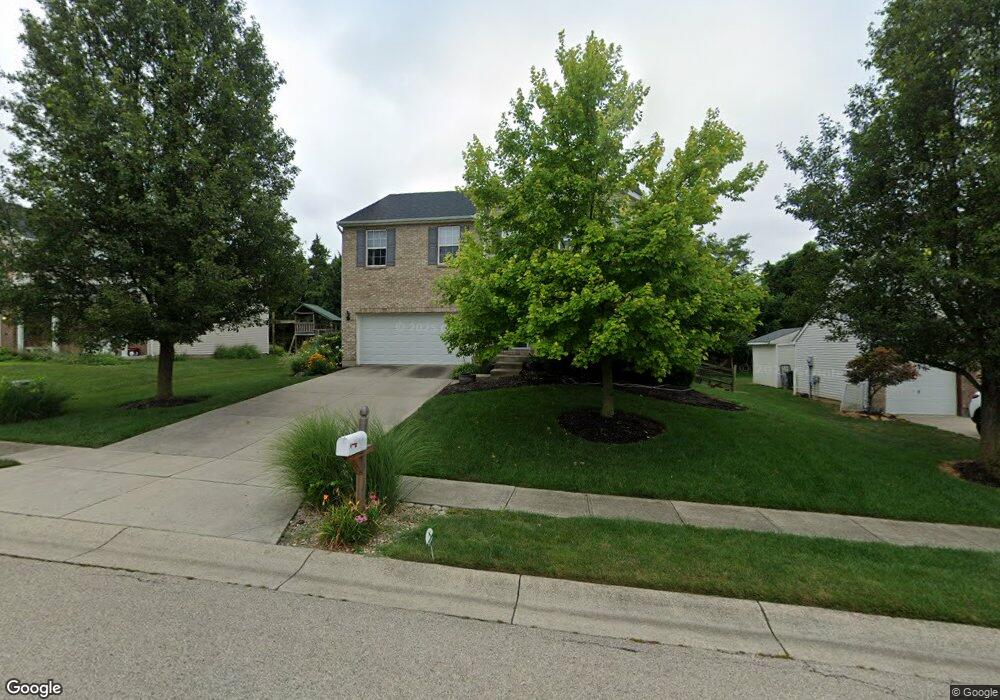
141 Evergreen Ct Franklin, OH 45005
Estimated Value: $331,000 - $376,000
4
Beds
3
Baths
2,452
Sq Ft
$142/Sq Ft
Est. Value
About This Home
This home is located at 141 Evergreen Ct, Franklin, OH 45005 and is currently estimated at $347,051, approximately $141 per square foot. 141 Evergreen Ct is a home located in Warren County with nearby schools including Franklin High School.
Ownership History
Date
Name
Owned For
Owner Type
Purchase Details
Closed on
Mar 25, 2008
Sold by
The Bank Of New York Trust Co
Bought by
Bowers Denise L and Bowers Donna S
Current Estimated Value
Home Financials for this Owner
Home Financials are based on the most recent Mortgage that was taken out on this home.
Original Mortgage
$158,695
Outstanding Balance
$97,309
Interest Rate
5.79%
Mortgage Type
FHA
Estimated Equity
$249,742
Purchase Details
Closed on
Dec 6, 2007
Sold by
Hill Melissa and The Bank Of New York Trust Co
Bought by
The Bank Of New York Trust Co
Purchase Details
Closed on
Aug 3, 2004
Sold by
Cristo Homes Inc
Bought by
Hill Melissa J
Home Financials for this Owner
Home Financials are based on the most recent Mortgage that was taken out on this home.
Original Mortgage
$155,541
Interest Rate
6.56%
Mortgage Type
Purchase Money Mortgage
Create a Home Valuation Report for This Property
The Home Valuation Report is an in-depth analysis detailing your home's value as well as a comparison with similar homes in the area
Home Values in the Area
Average Home Value in this Area
Purchase History
| Date | Buyer | Sale Price | Title Company |
|---|---|---|---|
| Bowers Denise L | $159,966 | Sovereign Title Agency Llc | |
| The Bank Of New York Trust Co | $144,000 | None Available | |
| Hill Melissa J | $194,433 | Guaranty Land Title |
Source: Public Records
Mortgage History
| Date | Status | Borrower | Loan Amount |
|---|---|---|---|
| Open | Bowers Denise L | $158,695 | |
| Previous Owner | Hill Melissa J | $155,541 | |
| Closed | Hill Melissa J | $38,885 |
Source: Public Records
Tax History
| Year | Tax Paid | Tax Assessment Tax Assessment Total Assessment is a certain percentage of the fair market value that is determined by local assessors to be the total taxable value of land and additions on the property. | Land | Improvement |
|---|---|---|---|---|
| 2025 | $4,385 | $93,180 | $21,000 | $72,180 |
| 2024 | $4,385 | $93,180 | $21,000 | $72,180 |
| 2023 | $3,870 | $73,787 | $12,390 | $61,397 |
| 2022 | $3,796 | $73,787 | $12,390 | $61,397 |
| 2021 | $3,599 | $73,787 | $12,390 | $61,397 |
| 2020 | $3,458 | $62,531 | $10,500 | $52,031 |
| 2019 | $3,145 | $62,531 | $10,500 | $52,031 |
| 2018 | $3,102 | $62,531 | $10,500 | $52,031 |
| 2017 | $3,085 | $56,021 | $9,142 | $46,879 |
| 2016 | $3,144 | $56,021 | $9,142 | $46,879 |
| 2015 | $3,145 | $56,021 | $9,142 | $46,879 |
| 2014 | $3,092 | $54,390 | $8,880 | $45,510 |
| 2013 | $2,655 | $64,330 | $10,500 | $53,830 |
Source: Public Records
Map
Nearby Homes
- 31 Sprucewood Ct
- 4100 Beal Rd
- 6 Beal Rd
- 5604 Ohio 123
- 5604 State Route 123
- 3574 Mclean Rd
- 5265 Robinson Vail Rd
- 6510 State Route 123
- 6510 Ohio 123
- 29 Louise Dr
- 4650 Shaker Rd
- 4640 Shaker Rd
- 25 Timber Creek Dr
- 65 Timber Creek Dr
- 6323 Shaker Rd
- 995 E 4th St
- 100 Pleasant Hill Blvd
- 0 Kathy Ln Unit 1834240
- 0 Kathy Ln Unit 930066
- 5744 Lynn St
- 131 Evergreen Ct
- 151 Evergreen Ct
- 121 Evergreen Ct
- 161 Evergreen Ct
- 132 Evergreen Ct
- 142 Evergreen Ct
- 122 Evergreen Ct
- 152 Evergreen Ct
- 112 Evergreen Ct
- 171 Evergreen Ct
- 101 Evergreen Ct
- 172 Evergreen Ct
- 241 Lakeview Dr
- 102 Evergreen Ct
- 301 Lakeview Dr
- 162 Evergreen Ct
- 231 Lakeview Dr
- 311 Lakeview Dr
- 91 Evergreen Ct
- 92 Evergreen Ct
Your Personal Tour Guide
Ask me questions while you tour the home.