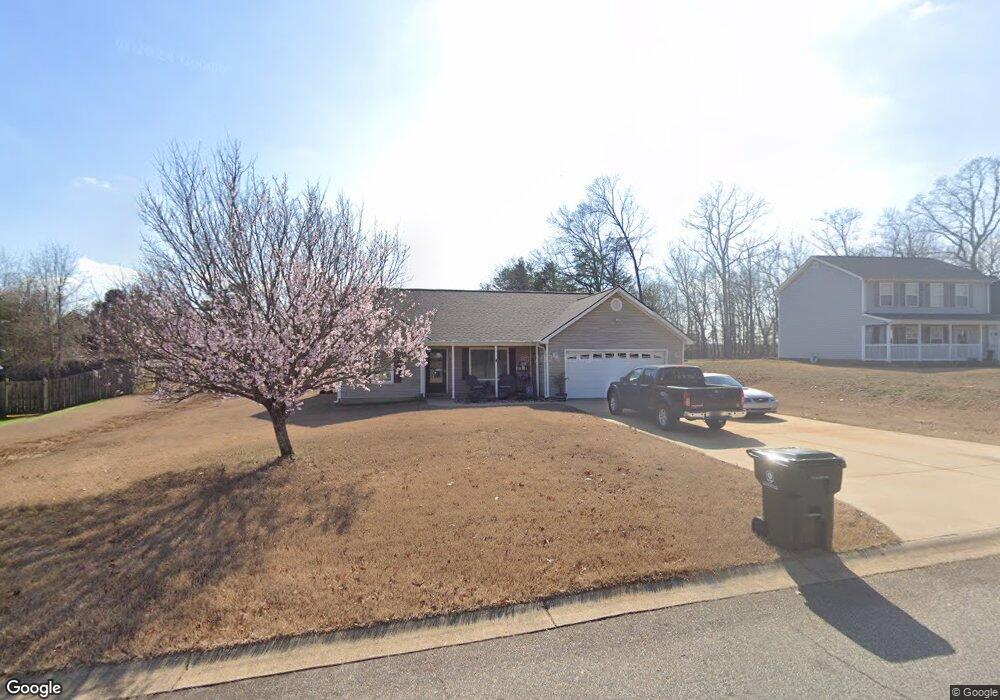
141 Jenna Grove Ln Duncan, SC 29334
Estimated Value: $235,262 - $268,000
3
Beds
2
Baths
2,754
Sq Ft
$91/Sq Ft
Est. Value
About This Home
This home is located at 141 Jenna Grove Ln, Duncan, SC 29334 and is currently estimated at $250,566, approximately $90 per square foot. 141 Jenna Grove Ln is a home located in Spartanburg County with nearby schools including Abner Creek Academy, Byrnes Freshman Academy, and Berry Shoals Intermediate School.
Ownership History
Date
Name
Owned For
Owner Type
Purchase Details
Closed on
Mar 14, 2014
Sold by
Engross David E and Engroos Christy L
Bought by
Eisenring Richard Jonathan and Eisenring Tammy Lemay
Current Estimated Value
Home Financials for this Owner
Home Financials are based on the most recent Mortgage that was taken out on this home.
Original Mortgage
$109,250
Outstanding Balance
$82,682
Interest Rate
4.3%
Mortgage Type
New Conventional
Estimated Equity
$167,884
Purchase Details
Closed on
Jun 18, 2009
Sold by
Johnson Tera L
Bought by
Engroos David E and Engroos Christy L
Home Financials for this Owner
Home Financials are based on the most recent Mortgage that was taken out on this home.
Original Mortgage
$88,800
Interest Rate
4.79%
Mortgage Type
Purchase Money Mortgage
Purchase Details
Closed on
Jun 30, 2003
Sold by
R & R Builders Llc
Bought by
Johnson Tera L
Purchase Details
Closed on
May 9, 2003
Sold by
Hearthstone Realty Inc
Bought by
R & R Builders Llc
Create a Home Valuation Report for This Property
The Home Valuation Report is an in-depth analysis detailing your home's value as well as a comparison with similar homes in the area
Home Values in the Area
Average Home Value in this Area
Purchase History
| Date | Buyer | Sale Price | Title Company |
|---|---|---|---|
| Eisenring Richard Jonathan | $115,000 | -- | |
| Engroos David E | $111,000 | -- | |
| Johnson Tera L | $101,600 | Hanover Title Agency | |
| R & R Builders Llc | $80,000 | -- |
Source: Public Records
Mortgage History
| Date | Status | Borrower | Loan Amount |
|---|---|---|---|
| Open | Eisenring Richard Jonathan | $109,250 | |
| Previous Owner | Engroos David E | $88,800 |
Source: Public Records
Tax History Compared to Growth
Tax History
| Year | Tax Paid | Tax Assessment Tax Assessment Total Assessment is a certain percentage of the fair market value that is determined by local assessors to be the total taxable value of land and additions on the property. | Land | Improvement |
|---|---|---|---|---|
| 2025 | $980 | $6,062 | $1,311 | $4,751 |
| 2024 | $980 | $6,062 | $1,311 | $4,751 |
| 2023 | $980 | $6,062 | $1,311 | $4,751 |
| 2022 | $885 | $5,272 | $964 | $4,308 |
| 2021 | $885 | $5,272 | $964 | $4,308 |
| 2020 | $867 | $5,272 | $964 | $4,308 |
| 2019 | $865 | $5,272 | $964 | $4,308 |
| 2018 | $827 | $5,272 | $964 | $4,308 |
| 2017 | $717 | $4,584 | $1,000 | $3,584 |
| 2016 | $692 | $4,584 | $1,000 | $3,584 |
| 2015 | $2,481 | $6,618 | $1,500 | $5,118 |
| 2014 | $648 | $4,412 | $1,000 | $3,412 |
Source: Public Records
Map
Nearby Homes
- 253 Golden Bear Walk
- 737 Stilmore Dr
- 638 Grantleigh Dr
- 408 Royalston Ct
- 1011 Rogers Bridge Rd
- 254 Twilitemist Dr
- 624 S Morningwood Ln
- 147 Bearden Dr
- 1055 Summerlin Trail
- 644 Diamond Ridge Way
- 159 Rockingham Rd
- 167 Rockingham Rd
- 163 Rockingham Rd
- 141 Agnes Dr
- 800 Redmill Ln
- 516 S Pond View Dr
- 820 Redmill Ln
- 636 Sunwater Dr
- 3048 Olivette Place
- 3025 Olivette Place
- 151 Jenna Grove Ln
- 133 Jenna Grove Ln
- 129 Jenna Grove Ln
- 140 Jenna Grove Ln
- 161 Jenna Grove Ln
- 170 Jenna Grove Ln
- 160 Jenna Grove Ln
- 150 Jenna Grove Ln
- 394 Shadowfield Acres Dr
- 393 Shadowfield Acres Dr
- 120 Jenna Grove Ln
- 334 Dobson Rd
- 121 Jenna Grove Ln
- 115 Douglas Ln
- 342 Dobson Rd
- 390 Shadowfield Acres Dr
- 119 Douglas Ln
- 389 Shadowfield Acres Dr
- 117 Jenna Grove Ln
- 350 Dobson Rd