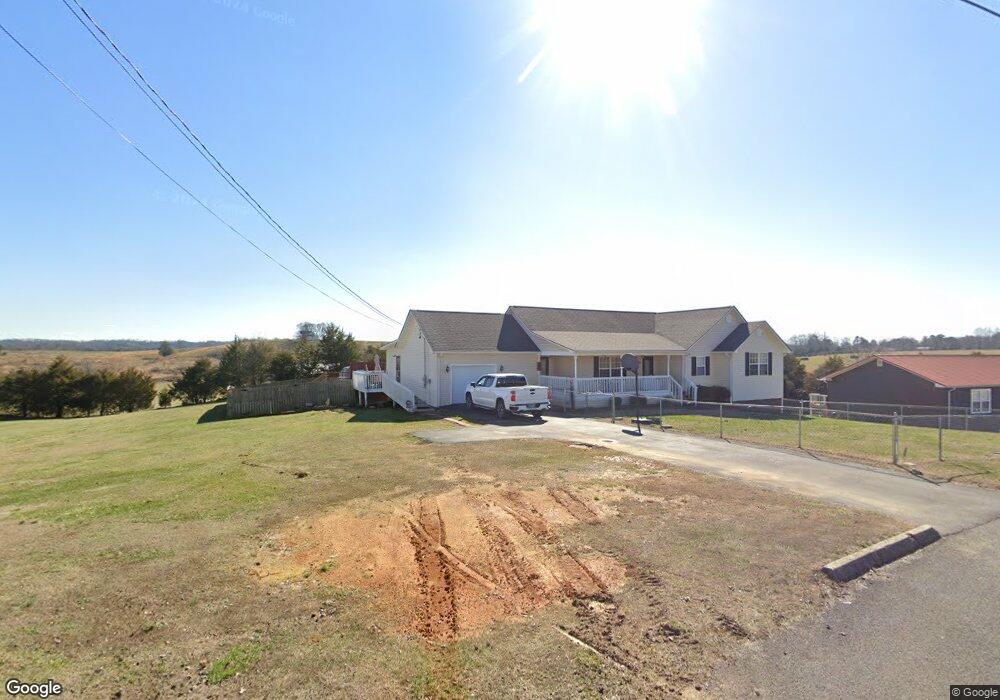
141 Murphy Rd Bulls Gap, TN 37711
Estimated Value: $249,000 - $422,000
3
Beds
2
Baths
1,723
Sq Ft
$195/Sq Ft
Est. Value
About This Home
This home is located at 141 Murphy Rd, Bulls Gap, TN 37711 and is currently estimated at $336,150, approximately $195 per square foot. 141 Murphy Rd is a home located in Hawkins County with nearby schools including Bulls Gap School, St. Clair Elementary School, and Cherokee High School.
Ownership History
Date
Name
Owned For
Owner Type
Purchase Details
Closed on
Aug 18, 2014
Sold by
Kitts Megan D
Bought by
Kitts Megan D
Current Estimated Value
Purchase Details
Closed on
Dec 3, 2013
Sold by
Citizens Bank Of East Tenn
Bought by
Kitts Megan D
Home Financials for this Owner
Home Financials are based on the most recent Mortgage that was taken out on this home.
Original Mortgage
$95,475
Interest Rate
4.19%
Mortgage Type
Commercial
Purchase Details
Closed on
Nov 1, 2012
Sold by
Coward Walter S
Bought by
Citizens Bank Of East Tn
Purchase Details
Closed on
Jun 5, 2006
Sold by
Glen Carroll and Glen Frances
Bought by
Walter Coward and Walter Helen
Home Financials for this Owner
Home Financials are based on the most recent Mortgage that was taken out on this home.
Original Mortgage
$110,000
Interest Rate
6.51%
Purchase Details
Closed on
Jul 28, 2000
Bought by
Carroll Glen and Carroll Frances
Create a Home Valuation Report for This Property
The Home Valuation Report is an in-depth analysis detailing your home's value as well as a comparison with similar homes in the area
Home Values in the Area
Average Home Value in this Area
Purchase History
| Date | Buyer | Sale Price | Title Company |
|---|---|---|---|
| Kitts Megan D | -- | -- | |
| Kitts Megan D | $100,500 | -- | |
| Citizens Bank Of East Tn | $166,050 | -- | |
| Walter Coward | $9,500 | -- | |
| Carroll Glen | $68,800 | -- |
Source: Public Records
Mortgage History
| Date | Status | Borrower | Loan Amount |
|---|---|---|---|
| Open | Carroll Glen | $180,000 | |
| Previous Owner | Kitts Megan D | $95,475 | |
| Previous Owner | Carroll Glen | $110,000 |
Source: Public Records
Tax History Compared to Growth
Tax History
| Year | Tax Paid | Tax Assessment Tax Assessment Total Assessment is a certain percentage of the fair market value that is determined by local assessors to be the total taxable value of land and additions on the property. | Land | Improvement |
|---|---|---|---|---|
| 2024 | $1,319 | $51,625 | $3,450 | $48,175 |
| 2023 | $1,200 | $51,625 | $0 | $0 |
| 2022 | $1,197 | $51,625 | $3,450 | $48,175 |
| 2021 | $1,119 | $51,625 | $3,450 | $48,175 |
| 2020 | $1,091 | $51,625 | $3,450 | $48,175 |
| 2019 | $1,091 | $43,100 | $2,925 | $40,175 |
| 2018 | $1,091 | $43,100 | $2,925 | $40,175 |
| 2017 | $1,091 | $43,100 | $2,925 | $40,175 |
| 2016 | $953 | $37,625 | $3,325 | $34,300 |
| 2015 | $927 | $37,625 | $3,325 | $34,300 |
| 2014 | -- | $42,925 | $3,325 | $39,600 |
Source: Public Records
Map
Nearby Homes
- Tbd Long Town Rd
- 348 Harris Town Rd
- lot 8 Harris Town Rd
- 317 Handy Ln
- 114 Robertson Creek Rd
- 293 Lee Valley Rd
- 716 Melinda Ferry Rd
- Tbd Melinda Ferry Rd
- Lot 2 Walkers Church Rd
- Lot 1 Walkers Church Rd
- 592 Melinda Ferry Rd
- Lot 6 Cantrell Rd
- Lot 1 Cantrell Rd
- Lot 2 Cantrell Rd
- Lot 3 Cantrell Rd
- 359 Buzzard Roost Rd
- 168 Buzzard Roost Rd
- 284 Buzzard Roost Rd
- 185 Green Rd
- Lot 2 Longtown Rd
- 145 Murphy Rd
- 137 Murphy Rd
- 134 Murphy Rd
- 133 Murphy Rd
- 134 Murphy Dr
- 149 Murphy Dr
- 130 Murphy Rd
- 149 Murphy Rd
- 150 Murphy Rd
- 126 Murphy Rd
- 129 Murphy Rd
- 159 Murphy Rd
- 159 Murphy Rd
- 121 Murphy Rd
- 154 Murphy Rd
- 154 Murphy Rd Unit s/d Hawk-Haven
- 117 Murphy Rd
- 117 Murphy Rd
- 1530 Highway 113
- 246 Whitaker Rd