G
Landlord's Agent in 2020
Gary Passineau
William Raveis Real Estate
Estimated Value: $640,000 - $696,000
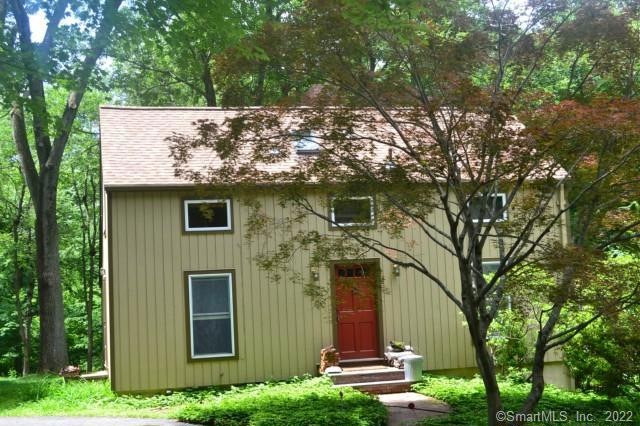
Convenient West Redding location but away from everything. Commune with nature on a pastoral 2.4 acre, level setting. Saltbox home features HW floors throughout, vaulted ceilings, beams, fireplace and skylights. Large, two-tiered deck overlooks perennial gardens and woods. The detached, three-bay garage boasts a spacious loft storage area. This location is so private, people won’t be able to find you. Excellent location for an artist, a writer, work at home, anyone who loves nature! Also known as 153 1/2 Barrett Lane.
Last Agent to Rent the Property
Gary Passineau
William Raveis Real Estate License #RES.0771449 Listed on: 03/09/2020

Co-Listed By
Sherry Wheeler
William Raveis Real Estate License #RES.0723345
Last Renter's Agent
Non Member
Non-Member
| Date | Buyer | Sale Price | Title Company |
|---|---|---|---|
| Hibben Charles W | $484,880 | None Available |
| Date | Status | Borrower | Loan Amount |
|---|---|---|---|
| Open | Hibben Charles W | $460,636 |
| Date | Event | Price | List to Sale | Price per Sq Ft |
|---|---|---|---|---|
| 04/01/2020 04/01/20 | Rented | $2,100 | 0.0% | -- |
| 03/31/2020 03/31/20 | Under Contract | -- | -- | -- |
| 03/24/2020 03/24/20 | For Rent | $2,100 | 0.0% | -- |
| 03/10/2020 03/10/20 | Off Market | $2,100 | -- | -- |
| 03/09/2020 03/09/20 | For Rent | $2,100 | 0.0% | -- |
| 09/06/2019 09/06/19 | Rented | $2,100 | -4.5% | -- |
| 07/16/2019 07/16/19 | For Rent | $2,200 | +4.8% | -- |
| 08/01/2015 08/01/15 | Rented | $2,100 | 0.0% | -- |
| 07/29/2015 07/29/15 | Under Contract | -- | -- | -- |
| 06/19/2015 06/19/15 | For Rent | $2,100 | -- | -- |
| Year | Tax Paid | Tax Assessment Tax Assessment Total Assessment is a certain percentage of the fair market value that is determined by local assessors to be the total taxable value of land and additions on the property. | Land | Improvement |
|---|---|---|---|---|
| 2025 | $10,555 | $357,300 | $144,300 | $213,000 |
| 2024 | $10,262 | $357,300 | $144,300 | $213,000 |
| 2023 | $9,894 | $357,300 | $144,300 | $213,000 |
| 2022 | $8,768 | $263,000 | $155,500 | $107,500 |
| 2021 | $8,637 | $263,000 | $155,500 | $107,500 |
| 2020 | $8,637 | $263,000 | $155,500 | $107,500 |
| 2019 | $8,637 | $263,000 | $155,500 | $107,500 |
| 2018 | $8,342 | $263,000 | $155,500 | $107,500 |
| 2017 | $7,980 | $269,400 | $155,900 | $113,500 |
| 2016 | $7,877 | $269,400 | $155,900 | $113,500 |
| 2015 | $7,788 | $269,400 | $155,900 | $113,500 |
| 2014 | $7,788 | $269,400 | $155,900 | $113,500 |
G
Landlord's Agent in 2020
Gary Passineau
William Raveis Real Estate
S
Landlord's Co-Listing Agent in 2020
Sherry Wheeler
William Raveis Real Estate
N
Tenant's Agent in 2020
Non Member
Non-Member
C
Buyer's Agent in 2019
Carol Pierce
William Raveis Real Estate
N
Buyer's Agent in 2015
Non-member Litchfield
Non Member Office
Source: SmartMLS
MLS Number: 170280104
APN: REDD-000027-000000-000008
Disclaimer: Certain information contained herein is derived from information provided by parties other than Homes.com. All information provided is deemed reliable, but is not guaranteed to be accurate and should be independently verified.
![]() IDX information is provided exclusively for personal, non-commercial use, and may not be used for any purpose other than to identify prospective properties consumers may be interested in purchasing. Information is deemed reliable but not guaranteed.
IDX information is provided exclusively for personal, non-commercial use, and may not be used for any purpose other than to identify prospective properties consumers may be interested in purchasing. Information is deemed reliable but not guaranteed.
Ask me questions while you tour the home.