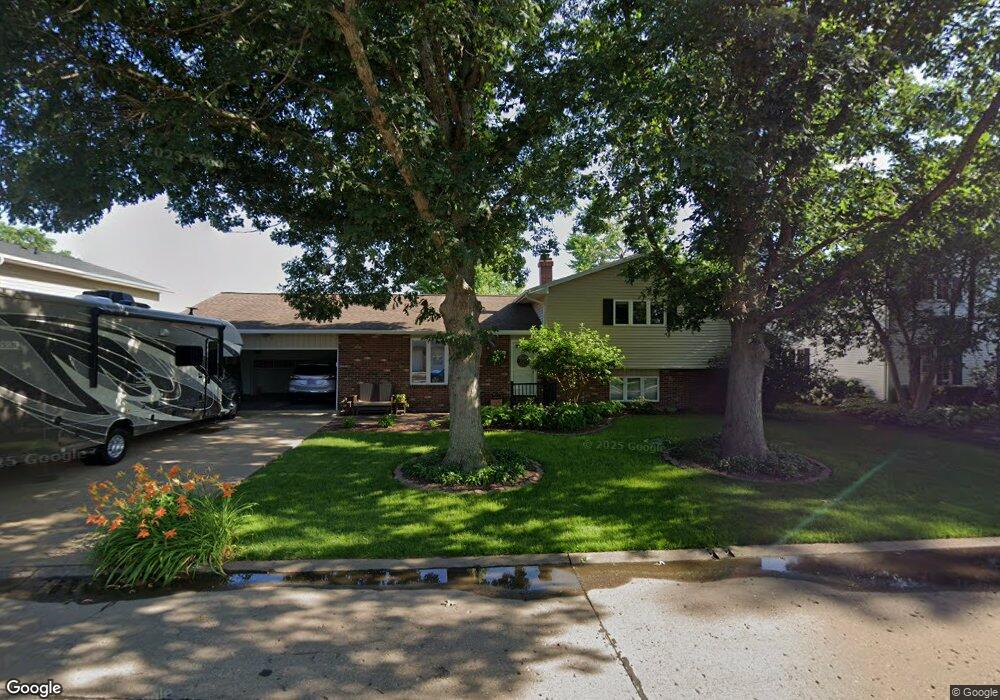
141 Pam Ln Macomb, IL 61455
Estimated Value: $132,000 - $172,000
4
Beds
--
Bath
1,386
Sq Ft
$113/Sq Ft
Est. Value
About This Home
This home is located at 141 Pam Ln, Macomb, IL 61455 and is currently estimated at $156,204, approximately $112 per square foot. 141 Pam Ln is a home located in McDonough County with nearby schools including Edison Elementary School, Lincoln Elementary School, and Macomb Junior High School.
Create a Home Valuation Report for This Property
The Home Valuation Report is an in-depth analysis detailing your home's value as well as a comparison with similar homes in the area
Home Values in the Area
Average Home Value in this Area
Tax History
| Year | Tax Paid | Tax Assessment Tax Assessment Total Assessment is a certain percentage of the fair market value that is determined by local assessors to be the total taxable value of land and additions on the property. | Land | Improvement |
|---|---|---|---|---|
| 2024 | $5,437 | $58,260 | $5,183 | $53,077 |
| 2023 | $5,519 | $55,836 | $4,967 | $50,869 |
| 2022 | $5,093 | $54,100 | $4,813 | $49,287 |
| 2021 | $4,887 | $54,100 | $4,813 | $49,287 |
| 2020 | $4,823 | $58,771 | $4,801 | $53,970 |
| 2019 | $5,386 | $55,462 | $4,934 | $50,528 |
| 2018 | $5,143 | $55,462 | $4,934 | $50,528 |
| 2017 | $5,027 | $55,462 | $4,934 | $50,528 |
| 2016 | $4,822 | $54,875 | $4,882 | $49,993 |
| 2015 | $4,732 | $53,620 | $4,770 | $48,850 |
| 2014 | $4,639 | $52,818 | $4,699 | $48,119 |
| 2013 | $4,542 | $52,818 | $4,699 | $48,119 |
Source: Public Records
Map
Nearby Homes
- 1823 S Madison St
- 413 Evergreen Dr
- 1905 S Madison St
- 201 Evergreen Dr
- 2005 S Madison St
- 1 Marty Ln
- 439 E Yeiser St
- 11 Marty Ln
- 301 E Summit St
- 1218 Joseph St
- 802 Bobby Ave
- 6 Marty Ln
- 703 E Franklin St
- 644 S Randolph St
- 239 W Fisk St
- 1009 S Candy Ln
- 704 S Lafayette St
- 236 W Fisk St
- 404 W Kelly St
- 329 W Fisk St
Your Personal Tour Guide
Ask me questions while you tour the home.