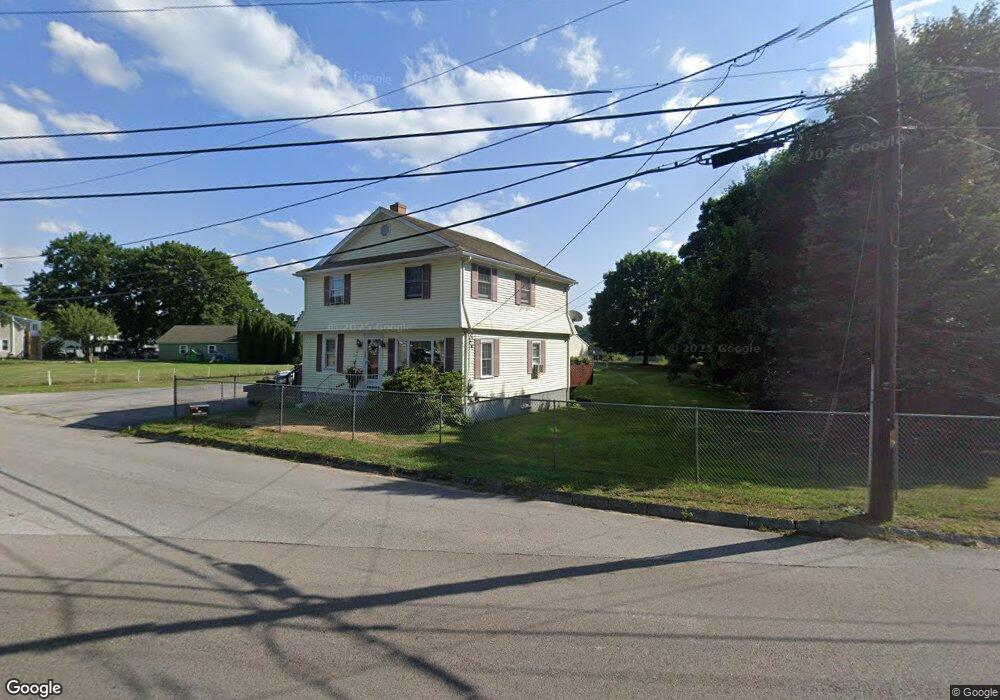
141 Providence St Rehoboth, MA 02769
Estimated Value: $602,083 - $748,000
3
Beds
2
Baths
2,164
Sq Ft
$301/Sq Ft
Est. Value
About This Home
This home is located at 141 Providence St, Rehoboth, MA 02769 and is currently estimated at $650,771, approximately $300 per square foot. 141 Providence St is a home located in Bristol County with nearby schools including Dighton-Rehoboth Regional High School, Highlander Charter Middle and High School, and East Bay Career Academy.
Ownership History
Date
Name
Owned For
Owner Type
Purchase Details
Closed on
Jun 24, 2021
Sold by
Cotter Cynthia A and Cotter Norman E
Bought by
Cotter Cynthia A and Cotter Norman E
Current Estimated Value
Purchase Details
Closed on
Mar 3, 2000
Sold by
Mclaughlin Bridget and Doran Elizabeth M
Bought by
Cotter Norman and Cotter Cynthia
Create a Home Valuation Report for This Property
The Home Valuation Report is an in-depth analysis detailing your home's value as well as a comparison with similar homes in the area
Home Values in the Area
Average Home Value in this Area
Purchase History
| Date | Buyer | Sale Price | Title Company |
|---|---|---|---|
| Cotter Cynthia A | -- | None Available | |
| Cotter Norman | $23,000 | -- |
Source: Public Records
Mortgage History
| Date | Status | Borrower | Loan Amount |
|---|---|---|---|
| Previous Owner | Cotter Norman | $115,000 | |
| Previous Owner | Cotter Norman | $127,000 | |
| Previous Owner | Cotter Norman | $1,286,000 |
Source: Public Records
Tax History Compared to Growth
Tax History
| Year | Tax Paid | Tax Assessment Tax Assessment Total Assessment is a certain percentage of the fair market value that is determined by local assessors to be the total taxable value of land and additions on the property. | Land | Improvement |
|---|---|---|---|---|
| 2025 | $55 | $494,800 | $176,100 | $318,700 |
| 2024 | $5,479 | $482,300 | $176,100 | $306,200 |
| 2023 | $4,818 | $466,400 | $172,700 | $293,700 |
| 2022 | $4,818 | $380,300 | $164,800 | $215,500 |
| 2021 | $4,761 | $359,600 | $149,400 | $210,200 |
| 2020 | $4,508 | $343,600 | $149,400 | $194,200 |
| 2018 | $4,008 | $334,800 | $142,400 | $192,400 |
| 2017 | $4,205 | $334,800 | $142,400 | $192,400 |
| 2016 | $4,068 | $334,800 | $142,400 | $192,400 |
| 2015 | $3,775 | $306,700 | $135,700 | $171,000 |
| 2014 | $3,625 | $291,400 | $129,300 | $162,100 |
Source: Public Records
Map
Nearby Homes
- 32 Providence St
- 203 Providence St Bldr Lot 5
- 205 Providence St Bldr Lot 3
- 127 Mason St
- 198 Brook St
- 17 Sassafras Rd
- 0 Winter St
- 267 Chestnut St
- 36 Columbine Rd
- 67 Wheeler St
- 1 Cedarbrook Unit A
- 10 Quaker Ln
- 195 Barney Ave
- 42 Linden Ln
- 92 Martin St
- 129 Cameron Way
- 3a Johnnies Way
- 3b Johnnies Way
- 3 Johnnies Way
- 8 Linden Ln