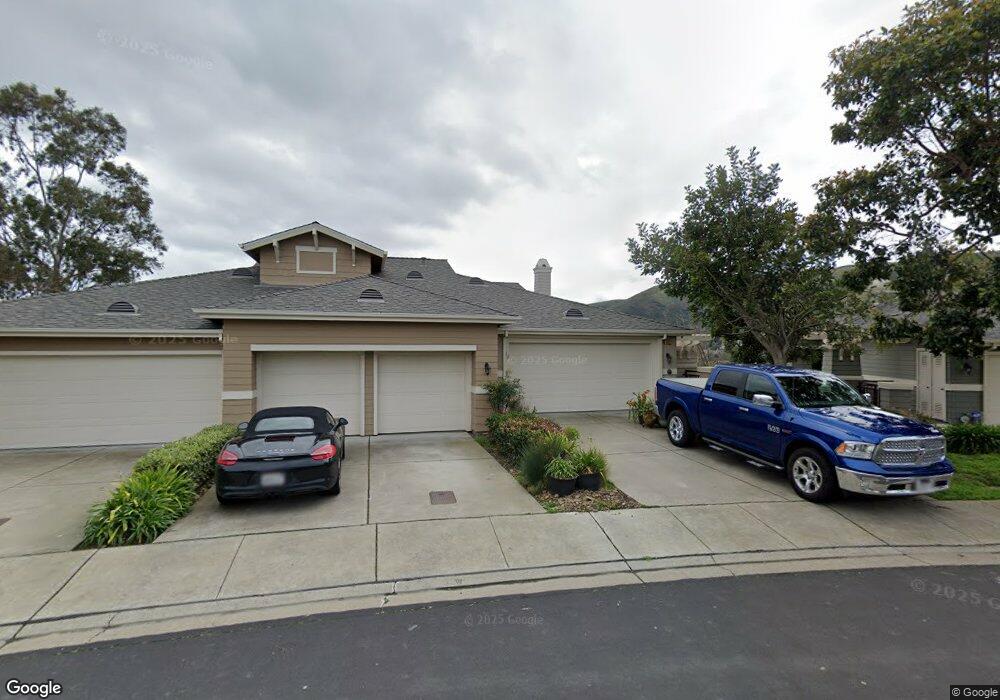
141 Red Hawk Ct Unit U933 Brisbane, CA 94005
Bayshore NeighborhoodEstimated Value: $1,230,000 - $1,316,000
3
Beds
3
Baths
2,273
Sq Ft
$564/Sq Ft
Est. Value
About This Home
This home is located at 141 Red Hawk Ct Unit U933, Brisbane, CA 94005 and is currently estimated at $1,282,053, approximately $564 per square foot. 141 Red Hawk Ct Unit U933 is a home located in San Mateo County with nearby schools including Brisbane Elementary School, Panorama Elementary School, and Lipman Middle School.
Ownership History
Date
Name
Owned For
Owner Type
Purchase Details
Closed on
Mar 30, 2016
Sold by
Breault Randy L and Breault Grace Smith
Bought by
The Breault Family Trust
Current Estimated Value
Purchase Details
Closed on
Sep 25, 2001
Sold by
Lehman Ellen
Bought by
Breault Randy L and Breault Grace A
Home Financials for this Owner
Home Financials are based on the most recent Mortgage that was taken out on this home.
Original Mortgage
$320,000
Outstanding Balance
$125,443
Interest Rate
6.91%
Mortgage Type
Purchase Money Mortgage
Estimated Equity
$1,156,610
Purchase Details
Closed on
Jul 30, 1999
Sold by
Brookfield Northeast Ridge I Inc
Bought by
Lehman Ellen
Home Financials for this Owner
Home Financials are based on the most recent Mortgage that was taken out on this home.
Original Mortgage
$311,800
Interest Rate
7.64%
Mortgage Type
Purchase Money Mortgage
Create a Home Valuation Report for This Property
The Home Valuation Report is an in-depth analysis detailing your home's value as well as a comparison with similar homes in the area
Home Values in the Area
Average Home Value in this Area
Purchase History
| Date | Buyer | Sale Price | Title Company |
|---|---|---|---|
| The Breault Family Trust | -- | None Available | |
| Breault Randy L | $640,000 | First American Title Co | |
| Lehman Ellen | $462,000 | First American Title Co |
Source: Public Records
Mortgage History
| Date | Status | Borrower | Loan Amount |
|---|---|---|---|
| Open | Breault Randy L | $320,000 | |
| Previous Owner | Lehman Ellen | $311,800 |
Source: Public Records
Tax History
| Year | Tax Paid | Tax Assessment Tax Assessment Total Assessment is a certain percentage of the fair market value that is determined by local assessors to be the total taxable value of land and additions on the property. | Land | Improvement |
|---|---|---|---|---|
| 2025 | $10,756 | $945,450 | $283,628 | $661,822 |
| 2023 | $10,756 | $908,739 | $272,615 | $636,124 |
| 2022 | $10,265 | $890,921 | $267,270 | $623,651 |
| 2021 | $10,147 | $873,453 | $262,030 | $611,423 |
| 2020 | $10,349 | $864,498 | $259,344 | $605,154 |
| 2019 | $10,451 | $847,548 | $254,259 | $593,289 |
| 2018 | $10,779 | $830,930 | $249,274 | $581,656 |
| 2017 | $10,720 | $814,638 | $244,387 | $570,251 |
| 2016 | $10,509 | $798,666 | $239,596 | $559,070 |
| 2015 | $10,191 | $786,671 | $235,998 | $550,673 |
| 2014 | $9,949 | $771,263 | $231,376 | $539,887 |
Source: Public Records
Map
Nearby Homes
- 141 Kestrel Ct Unit U751
- 0 Bayshore Unit ML82008650
- 2 Bayshore Blvd
- 332 Crescent Ct
- 313 Crescent Ct
- 18 Visitacion Ave
- 1 San Bruno Ave Unit J
- 1 San Bruno Ave
- 633 Swallowtail Ct
- 339 Monterey St
- 147 Elderberry Ln
- 335 Monterey St
- 37 San Francisco Ave
- 209 Bay Ridge Dr
- 129 Alvarado St
- 300 Klamath St
- 962 Martin Trail
- 163 Peabody St
- 163 165 Peabody St
- 112 Peabody St
- 162 Red Hawk Ct
- 151 Red Hawk Ct
- 153 Red Hawk Ct Unit U921
- 143 Red Hawk Ct
- 173 Red Hawk Ct
- 172 Red Hawk Ct Unit U902
- 163 Red Hawk Ct
- 152 Red Hawk Ct Unit U922
- 142 Red Hawk Ct
- 161 Red Hawk Ct Unit U911
- 171 Red Hawk Ct
- 142 Cliff Swallow Ct Unit U872
- 152 Cliff Swallow Ct Unit U884
- 141 Cliff Swallow Ct Unit U873
- 123 Cliff Swallow Ct Unit 853
- 122 Cliff Swallow Ct Unit U852
- 113 Cliff Swallow Ct Unit U842
- 112 Cliff Swallow Ct
- 151 Cliff Swallow Ct
- 163 Cliff Swallow Ct Unit U893
Your Personal Tour Guide
Ask me questions while you tour the home.