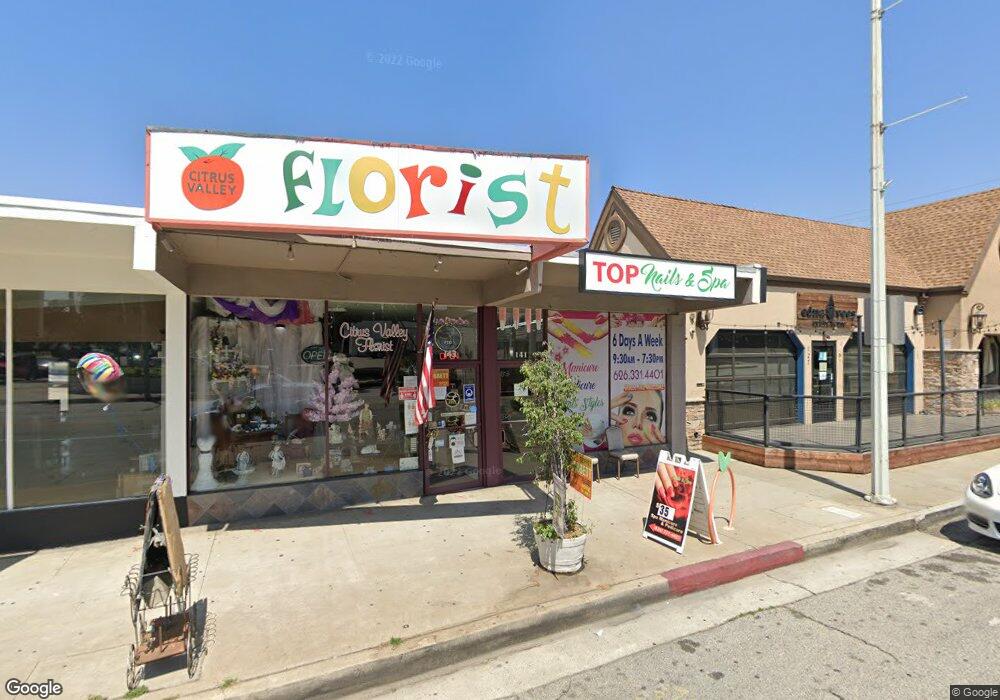
141 S Citrus Ave Covina, CA 91723
--
Bed
--
Bath
3,510
Sq Ft
6,752
Sq Ft Lot
About This Home
This home is located at 141 S Citrus Ave, Covina, CA 91723. 141 S Citrus Ave is a home located in Los Angeles County with nearby schools including Workman Elementary School, Traweek Middle School, and Covina High School.
Ownership History
Date
Name
Owned For
Owner Type
Purchase Details
Closed on
May 21, 2015
Sold by
Rjs Financial Inc
Bought by
Power Minute Vision Properties Llc
Home Financials for this Owner
Home Financials are based on the most recent Mortgage that was taken out on this home.
Original Mortgage
$400,000
Outstanding Balance
$307,474
Interest Rate
3.62%
Mortgage Type
Commercial
Purchase Details
Closed on
Nov 21, 2013
Sold by
Harris Doris M
Bought by
Waters Donald L and Perez Albert A
Home Financials for this Owner
Home Financials are based on the most recent Mortgage that was taken out on this home.
Original Mortgage
$450,000
Interest Rate
4.23%
Mortgage Type
Commercial
Purchase Details
Closed on
Dec 2, 2009
Sold by
Harris Doris M
Bought by
Freestone Mary
Purchase Details
Closed on
Jun 23, 1995
Sold by
Harris William B and Harris Doris M
Bought by
Harris William B
Create a Home Valuation Report for This Property
The Home Valuation Report is an in-depth analysis detailing your home's value as well as a comparison with similar homes in the area
Home Values in the Area
Average Home Value in this Area
Purchase History
| Date | Buyer | Sale Price | Title Company |
|---|---|---|---|
| Power Minute Vision Properties Llc | $700,000 | Chicago Title Company | |
| Rjs Financial Inc | $566,000 | None Available | |
| Waters Donald L | $670,000 | Chicago Title Company | |
| Freestone Mary | -- | None Available | |
| Harris William B | -- | -- | |
| Harris William B | -- | -- |
Source: Public Records
Mortgage History
| Date | Status | Borrower | Loan Amount |
|---|---|---|---|
| Open | Power Minute Vision Properties Llc | $400,000 | |
| Previous Owner | Waters Donald L | $450,000 |
Source: Public Records
Tax History Compared to Growth
Tax History
| Year | Tax Paid | Tax Assessment Tax Assessment Total Assessment is a certain percentage of the fair market value that is determined by local assessors to be the total taxable value of land and additions on the property. | Land | Improvement |
|---|---|---|---|---|
| 2025 | $11,169 | $841,287 | $288,440 | $552,847 |
| 2024 | $11,169 | $824,792 | $282,785 | $542,007 |
| 2023 | $11,005 | $808,621 | $277,241 | $531,380 |
| 2022 | $10,856 | $792,766 | $271,805 | $520,961 |
| 2021 | $10,685 | $777,223 | $266,476 | $510,747 |
| 2019 | $10,437 | $754,172 | $258,573 | $495,599 |
| 2018 | $9,942 | $739,385 | $253,503 | $485,882 |
| 2016 | $9,409 | $710,675 | $243,660 | $467,015 |
| 2015 | $8,943 | $683,385 | $214,195 | $469,190 |
| 2014 | -- | $670,000 | $210,000 | $460,000 |
Source: Public Records
Map
Nearby Homes
- 342 Hollenbeck
- 139 E Puente St
- 251 E Center St
- 270 E Puente St
- 402 Shelby Ln
- 216 W Merlot Dr Unit 58
- 530 S Stewart Dr
- 540 N Howard Ave
- 554 N Cabernet Dr
- 577 S Albertson Ave
- 123 S Hollenbeck Ave
- 265 W Pershing Ct
- 511 W Puente St Unit 1
- 543 W Puente St Unit 3
- 545 W Puente St Unit 2
- 447 S Newton St
- 182 E Kelby St
- 658 Calamansi Dr
- 125 S Armel Dr
- 652 Calamansi Dr
- 119 W Center St
- 203 S Citrus Ave
- 125 W Center St
- 124 W Center St
- 135 W Center St
- 211 S Citrus Ave
- 126 W Center St
- 142 W Center St
- 142 W Center St Unit A
- 124 S Citrus Ave
- 143 W Center St
- 136 W Center St
- 147 W Center St
- 100 S Citrus Ave
- 100 S Citrus Ave Unit 105
- 100 S Citrus Ave Unit 106
- 100 S Citrus Ave Unit 102
- 116 E Center St
- 140 W Center St
- 116 E Center St